Evaluating the results of your experiments depends on the type of A/B tests you used.
Data is abundant, but getting real insights from it and making the right decisions is no easy task. Understanding the subtle differences between the various types of A/B tests will make you a much better decision-maker and make your job easier.
In this post, we’ll discuss how to evaluate the different types of A/B test results.
Variant A/B tests
Running Variant A/B tests is the most popular way to A/B test different messages, value propositions, or calls-to-action. The main question here is usually about which variant will convert the best.
The performance of these variant A/B tests can be measured in 3 different ways:
1. Overall campaign performance
Marketers often measure their popup performance based on conversions or leads—which are defined by how well popups turn visitors into subscribers or buyers.
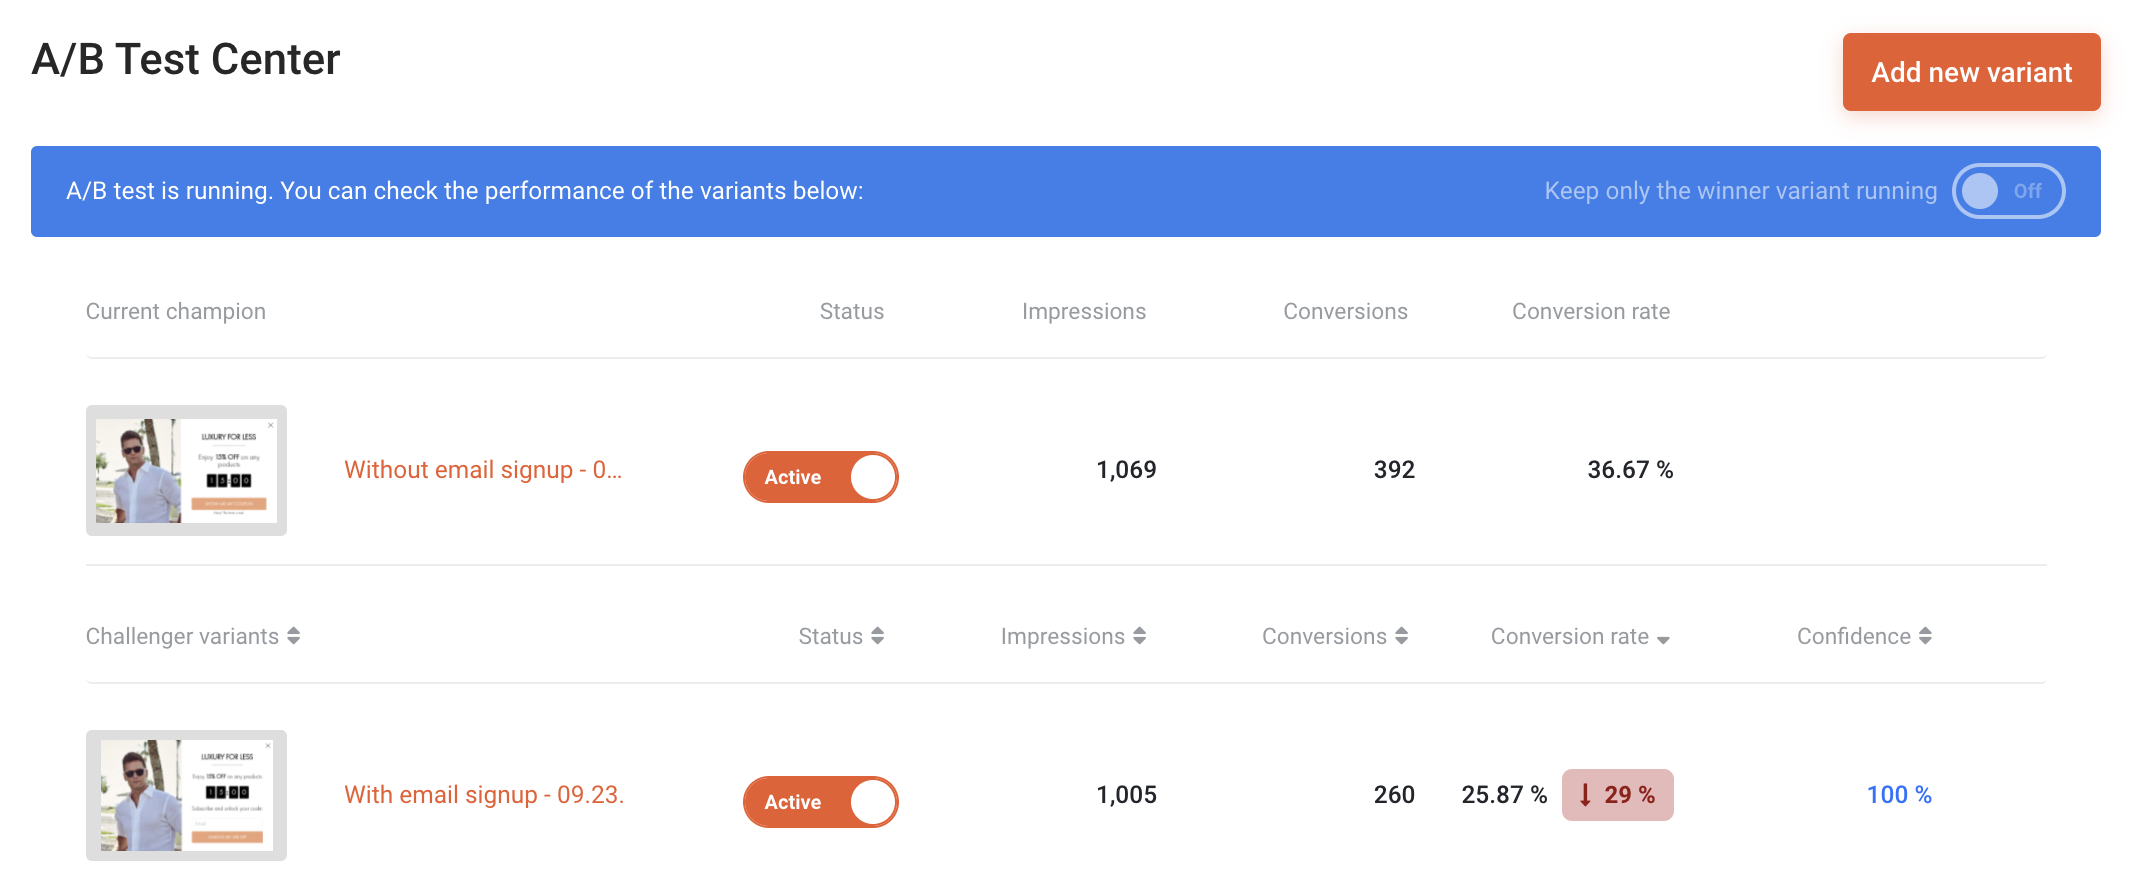
You can measure the results of your Variant A/B tests in terms of popup impressions and conversions. This is best done on the OptiMonk admin panel:
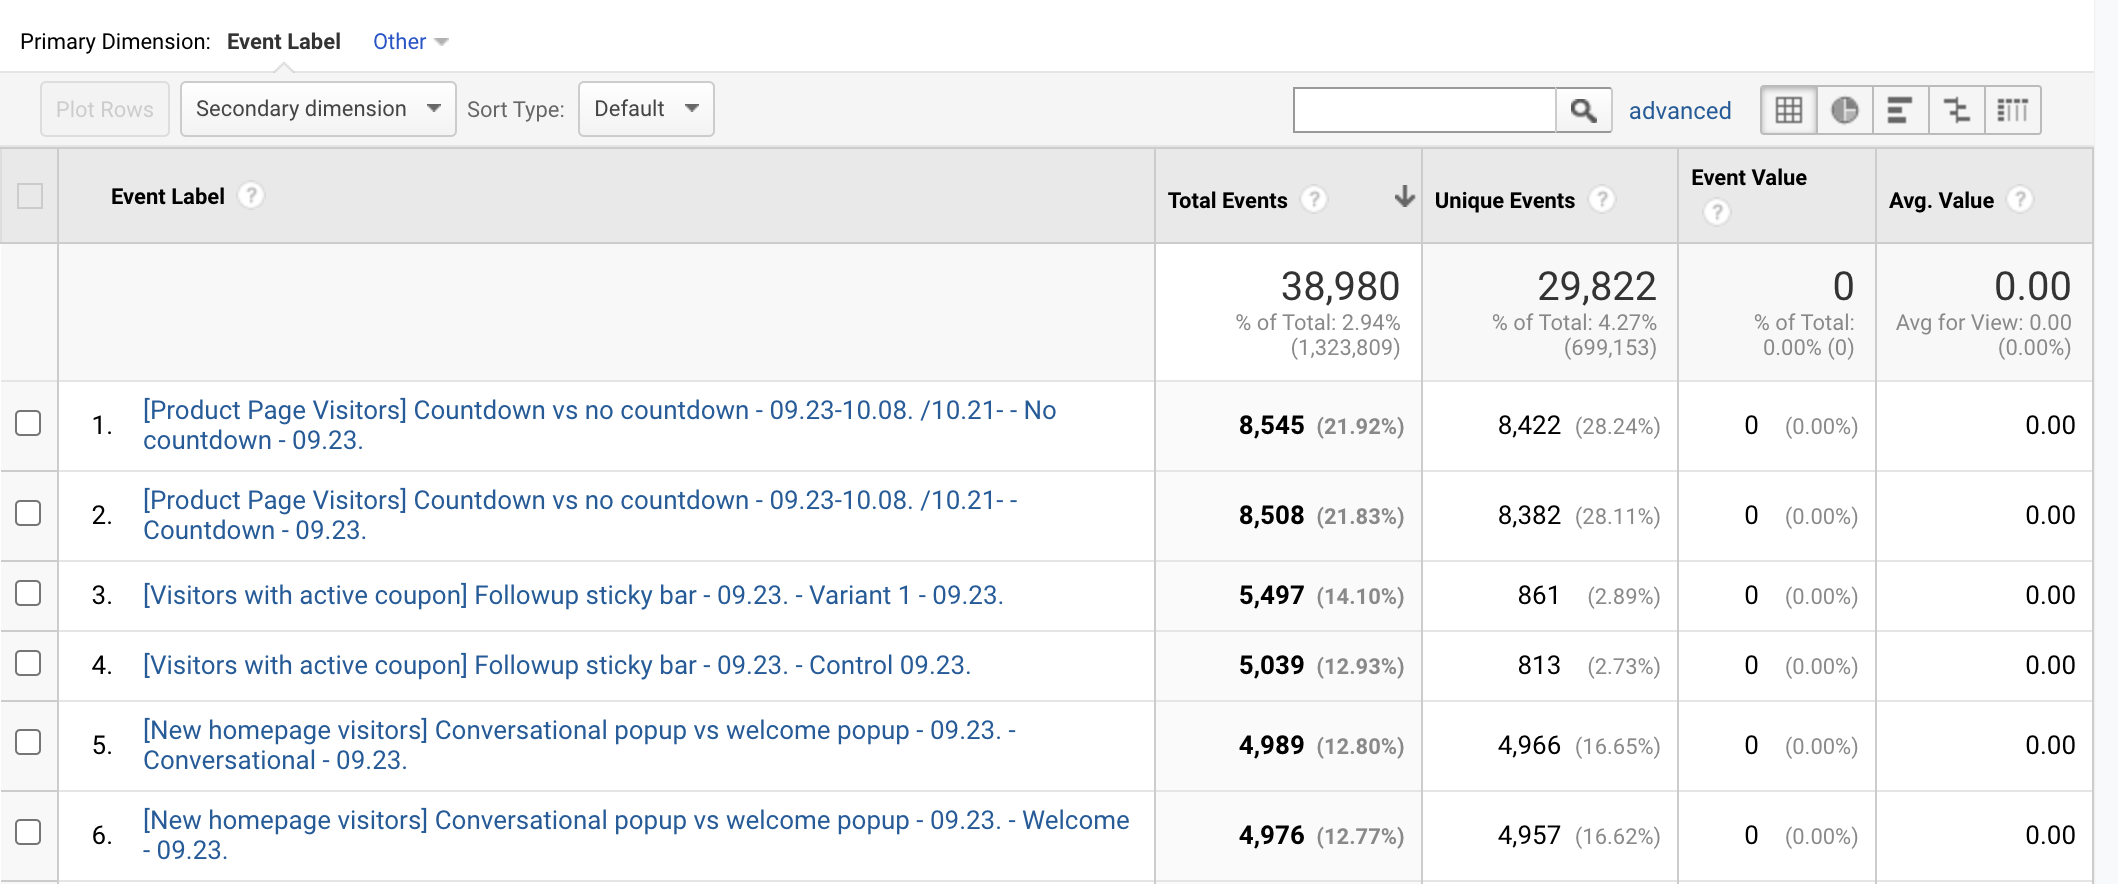
You can also measure them in Google Analytics since all popup events are automatically sent there.
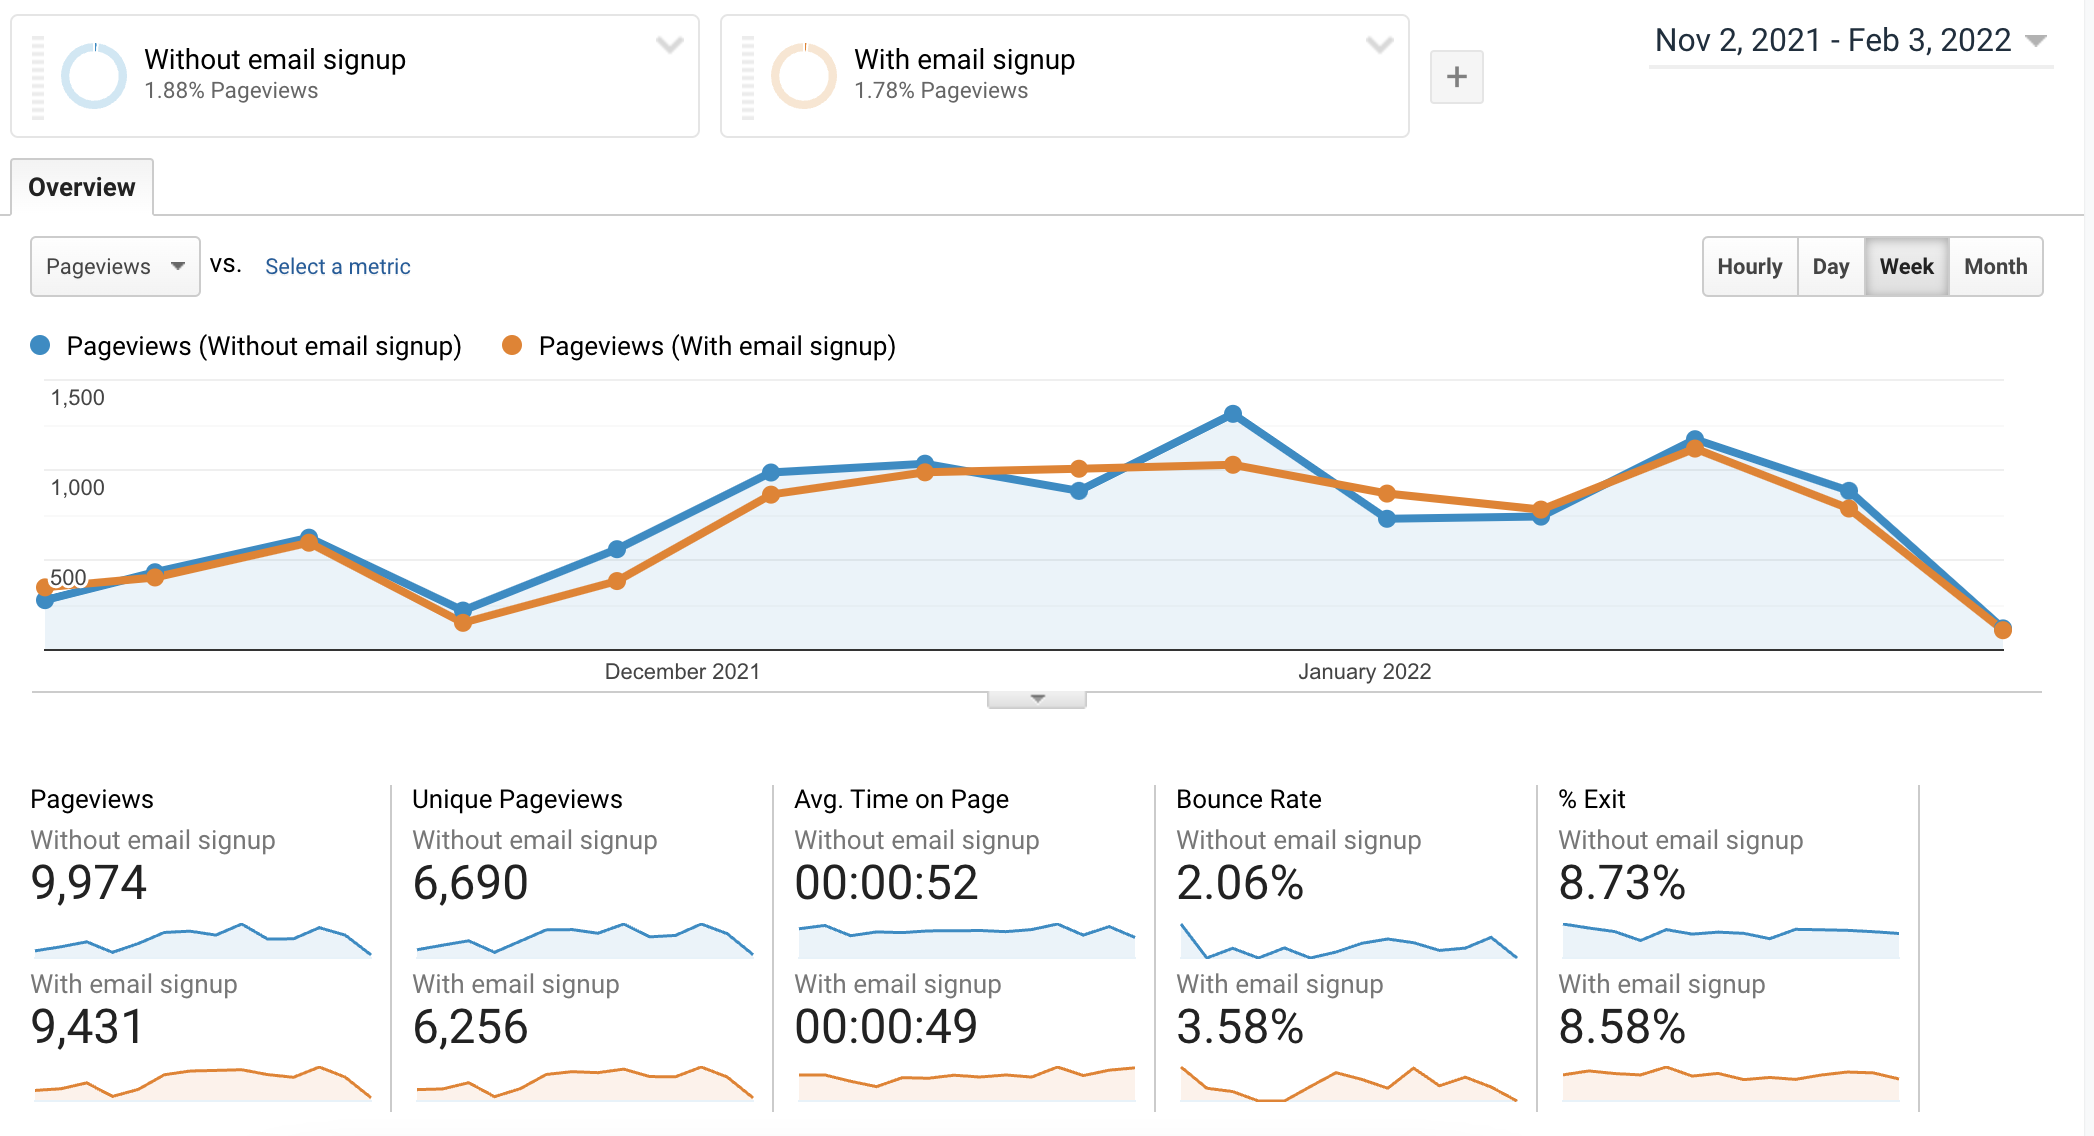
You can even create segments in Google Analytics based on these events and compare the behavior of your users in these segments.
2. Campaign Assisted Revenue
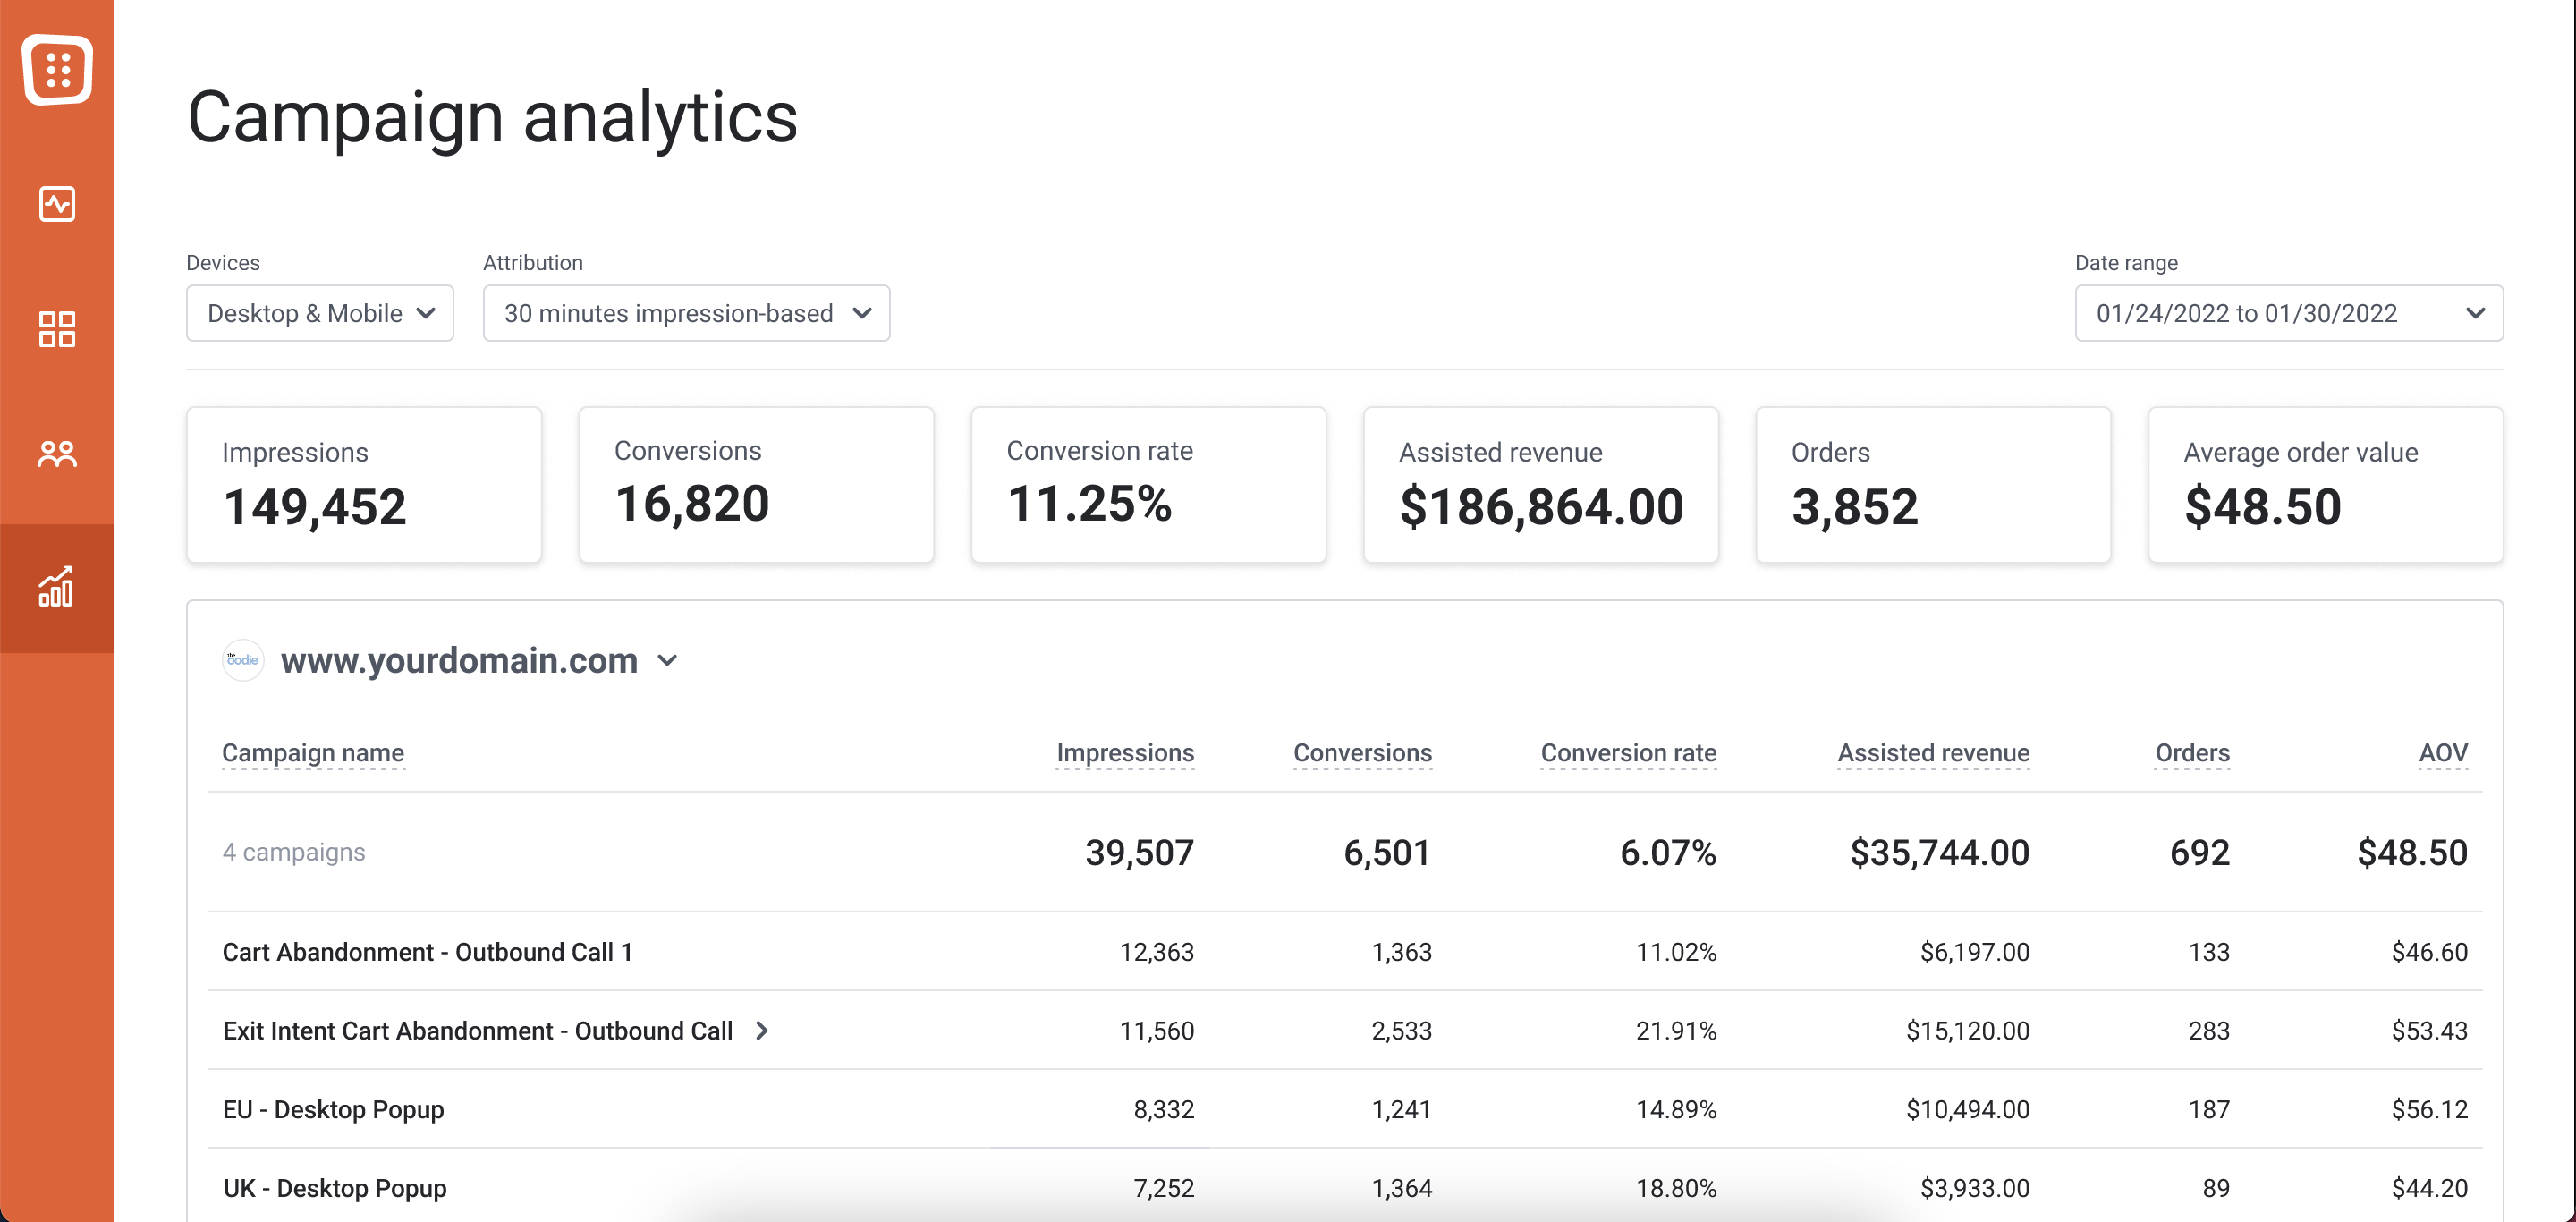
If measuring your conversion rates isn’t enough data, and you also want to measure your Campaign Assisted Revenue, you have two options:
- Built-in analytics: You can use our built-in analytics (available upon request) to measure In-session attribution and 5-day attribution.
- Google Analytics: You can set up segments in Google Analytics to measure your assisted revenue for each campaign (by using the event pushed in Google Analytics automatically).
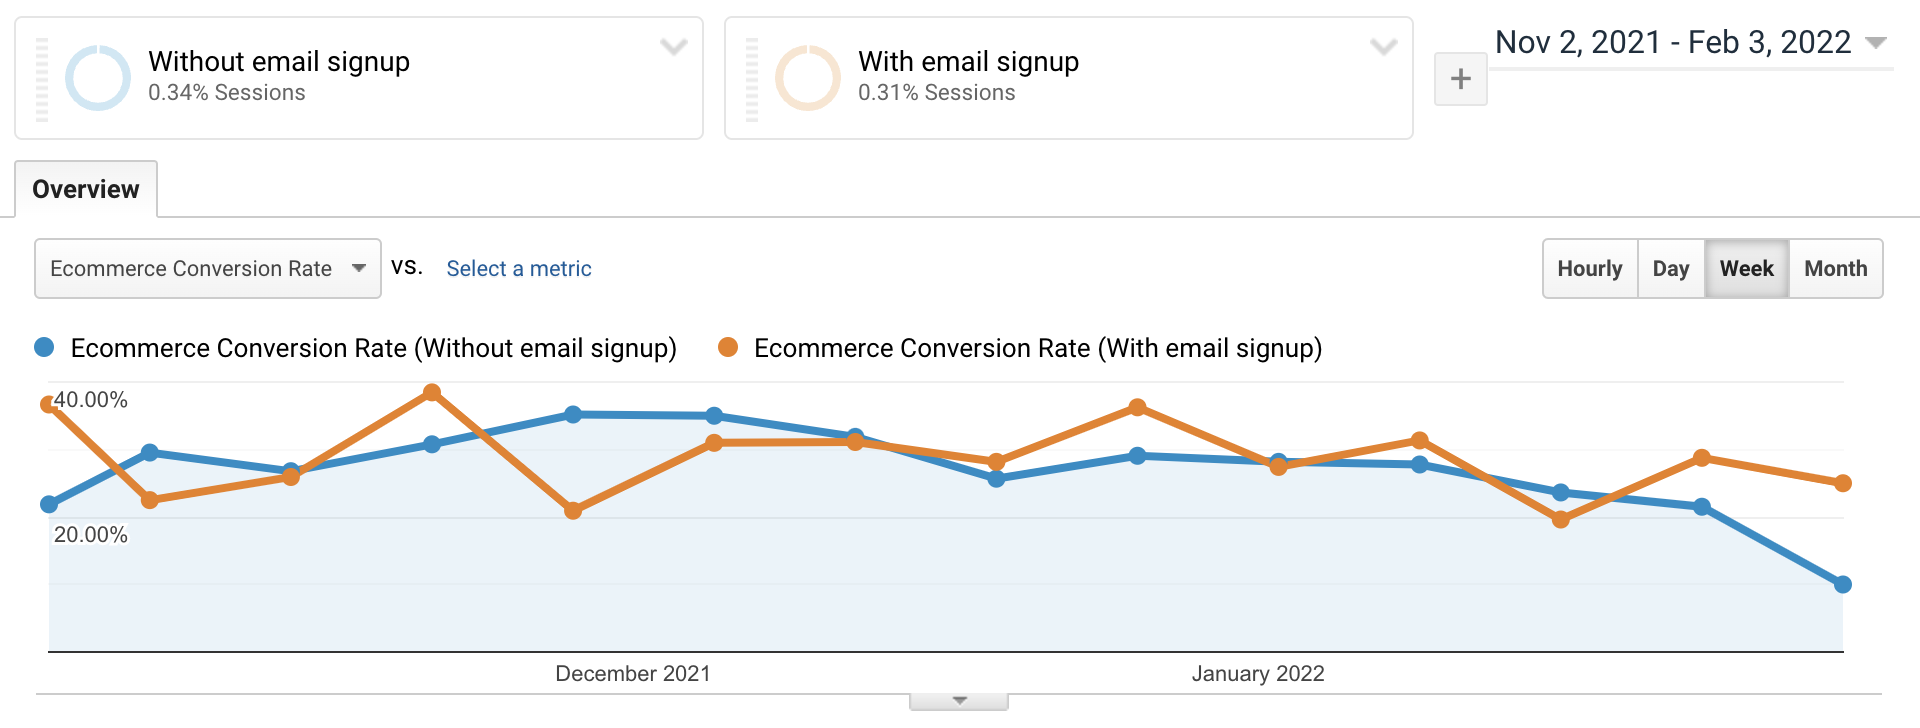
3. Total Assisted Revenue
OptiMonk also measures the Total Assisted Revenue of your campaigns. You can see your Total Assisted Revenue on the main dashboard of OptiMonk if you’re a Shopify user.

You can also use the Built-in Analytics of OptiMonk (currently available only upon request) to break it down to the campaign level.
Store-level A/B tests
And finally, if you want to measure your Net Assisted Revenue, the most reliable method is using Google Analytics.
After you set up your Store-level A/B testing, OptiMonk will automatically send an event for every visitor, assigning one of the cookie events at the first pageview.
You’ll be able to see these events in Google Analytics.

Based on these events you can set up segments for each one.
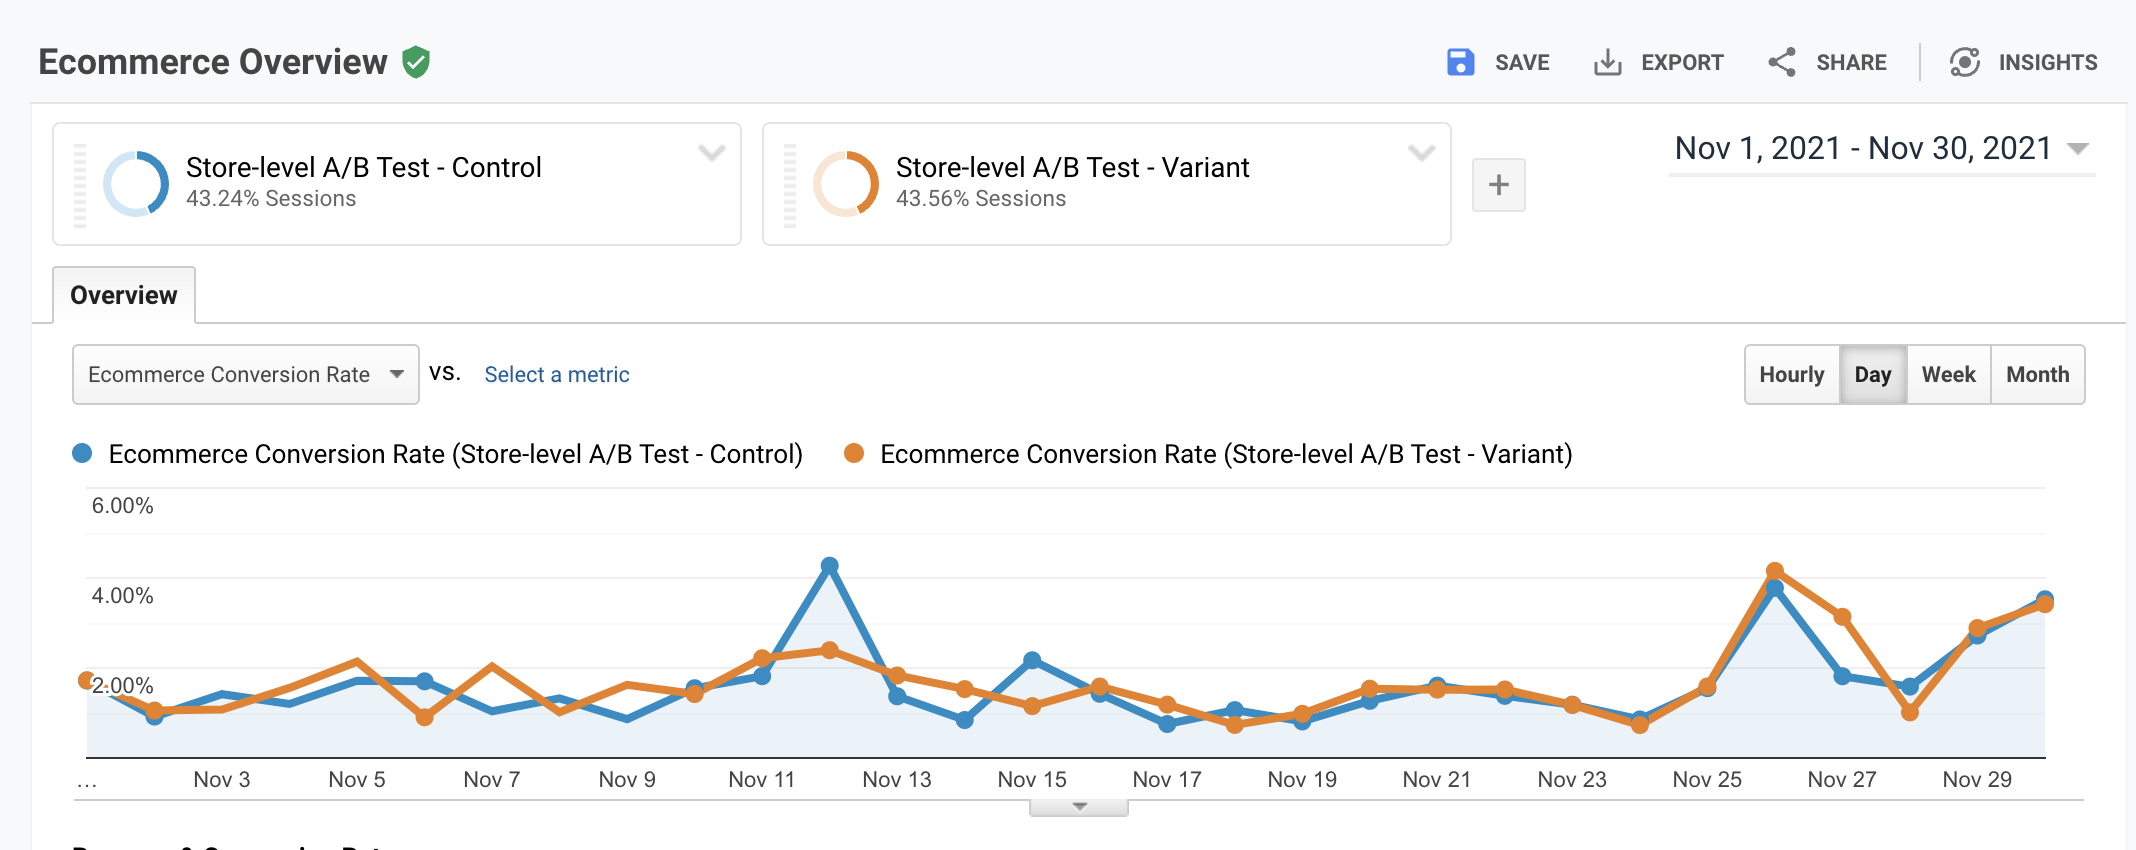
Now you’re able to compare the results of these segments and measure the overall In-session Pageview-Based assisted revenue of each variant, which is the closest we can get in Google Analytics to Net Assisted Revenue.
We always aim for statistically significant results per experiment.


