Engagement and retention are the dynamic duo of any successful business, digital platform, or team. They’re distinct, yet they often work hand in hand to achieve spectacular results.
But what exactly do we mean by engagement vs retention? How do they differ, and more importantly, how do they complement each other in the grand scheme of a business strategy?
Let’s break it down.
User engagement
When we talk about user engagement, think of it as the level of interaction and participation your users or customers have with your brand, product, or platform.
It’s all about how actively involved they are. This isn’t just about logging in or showing up; it’s about how much they interact with what you offer.
Examples of engagement metrics include:
- Time spent on a platform: Like how long someone binge-watches shows on a streaming service or scrolls through social media. More time often means they’re pretty hooked.
- Interaction rates: This could be anything from commenting on a blog post, sharing a product with friends, or even how often they click around your website. High interaction means they’re not just passing by; they’re engaged and interested.
Why is it important to measure engagement?
User engagement goes beyond just feeling happy with a service; it’s about feeling part of something bigger.
When users are engaged, they’re more likely to interact with each other, share their experiences, and become advocates for the brand.
This sense of community fosters loyalty, turning users into champions for your brand.
How to track engagement?
Luckily, there’s no shortage of tools to help you measure engagement.
From Google Analytics to specialized software like Mixpanel or Amplitude, these tools track everything from page views and time on site to more nuanced interactions like social shares and comments.
Using these tools, you can get a clear picture of how users interact with your platform.
By analyzing engagement metrics, you can identify patterns and trends.
Maybe you’ll find that users love interactive content but rarely share it on social media. Or perhaps you’ll discover that certain topics drive more comments and discussion.
These insights are gold dust for improving user experience. They help you understand what works, what doesn’t, and where there’s room for innovation.
Customer retention
Moving on to customer or user retention… This is the art of keeping your users or customers around for the long haul.
It’s one thing to attract people, but it’s another to make them want to stay.
Retention metrics focus on the long-term relationship and the repeat interactions individuals have with your brand or platform.
Examples of retention metrics include:
- Repeat purchases: This shows that customers aren’t just one-hit wonders; they come back because they like what you’ve got.
- Renewal rates: Especially relevant for services with subscriptions. High renewal rates indicate that people see enough value in what you offer to continue the relationship.
Why is it important to measure retention?
Acquiring a new customer (or user) can cost five times more than retaining an existing one. That’s a hefty price tag for growth if you’re constantly looking for newbies.
Investing in retention means you’re optimizing your resources, focusing on keeping the users you already have happy and engaged, which is far more cost-effective.
When customers stick around for the long haul, they contribute more to your revenue over time.
This isn’t just about repeat purchases; it’s also about upselling, cross-selling, and even referrals. A loyal customer is like a gift that keeps on giving.
They’re more likely to try new products, provide valuable feedback, and bring in new customers through word-of-mouth.
How to track retention?
The foundation of tracking retention is identifying the right metrics that align with your business goals and customer journey. These metrics will vary depending on the nature of your business (e.g., SaaS, e-commerce, service-based).
Is it a customer making a repeat purchase within a certain timeframe? Is it a subscriber renewing their subscription? Or, in the case of a free app, is it a user returning to use the app within a certain period? Clearly defining this will guide what data you need to collect.
Tools like Google Analytics, Mixpanel, or customer relationship management (CRM) systems can track user or customer behavior over time. These platforms allow you to see how often users return, which features keep them coming back, or how frequently customers make repeat purchases.
How to calculate the retention rate?
The retention rate is a formula that measures the percentage of customers or users who remain engaged with your service or product over a specific period.
You can calculate retention rate by taking the number of users at the end of a period, subtracting the number of new users acquired during that period, dividing by the total number of users at the start of the period, and multiplying by 100 to get a percentage.
Engagement and retention: complementary strategies
Now that we’ve unpacked what engagement and retention each stand for, it’s time to look at them through a different lens.
Imagine them not as separate entities but as partners in a dance, each step and turn by one leading to a graceful response by the other.
Together, they create a beautiful performance that captivates the audience – in this case, your users or customers.
How does engagement drive retention?
Think of engagement as the spark that ignites the flame of retention. It’s the initial excitement and ongoing interaction that makes users feel like they’re part of something special. This connection taps into deep psychological needs for belonging and value.
When users find a platform or brand that not only acknowledges their presence but also values their input, a powerful bond is formed. This bond is the essence of retention.
Simply put, when users feel engaged, they’re more likely to stick around. It’s the warmth of the community and the value they perceive in being part of it that keep them coming back.
The feedback loop between engagement and retention
Picture this as a cycle of continuous improvement. Engagement strategies provide valuable insights into what users enjoy and value, which in turn informs how to keep them satisfied and loyal over time.
This feedback loop is crucial.
For instance, if interactive content drives high engagement, ensuring that such content remains consistently fresh and relevant can improve retention.
Likewise, understanding why users stay can help refine engagement tactics to attract similar users and meet their expectations.
3 customer retention strategies for 2024
Now let’s take a look at some ecommerce customer retention strategies that not only improve customer satisfaction but also significantly increase the lifetime value of each customer.
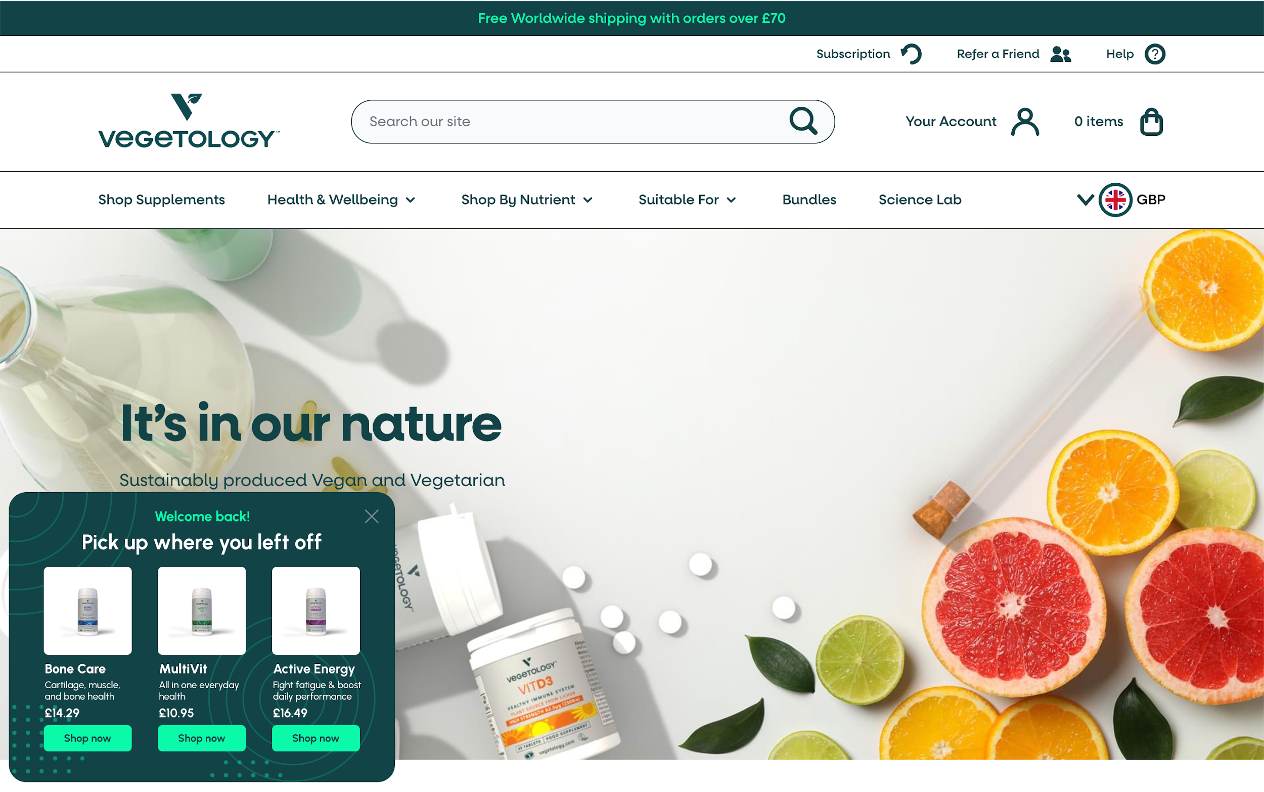
1. Help returning visitors continue where they left off
Most customers visit an ecommerce website multiple times before finalizing a purchase.
Recognizing and facilitating this browsing behavior can dramatically enhance the user experience.
For returning customers, implementing a feature that allows them to pick up right where they left off – perhaps through a simple popup showcasing previously viewed items – can be a game-changer.
This approach not only personalizes the shopping experience but can also boost conversion rates by a notable 3-5%.
2. Display active coupon reminders
Leveraging coupon codes as part of your retention strategy? Ensure your customers remember to use them by incorporating a follow-up sticky bar on your site.
This constant, unobtrusive reminder can encourage customers to proceed to checkout, utilizing their discounts, and thereby, cementing the efficacy of coupons in your retention arsenal.

Try these sticky bar templates to get started with this strategy:
3. Highlight new arrivals
Highlighting new products is a fantastic way to re-engage existing customers.
For those who are genuine fans of your brand, the announcement of new arrivals, especially with special discounts for returning customers, can reignite their interest and encourage repeat visits and purchases.
Here’s an example from Vegetology:

Wrapping up
In essence, engagement and retention are not just closely related; they’re symbiotic.
Engagement breathes life into the user experience, making each interaction feel personal and meaningful, which naturally feeds into retention.
A user who feels valued and engaged is more likely to become a long-term advocate and customer. Meanwhile, focusing on retention provides the insights needed to fine-tune engagement strategies, creating a self-reinforcing cycle of growth and loyalty.
Balancing these efforts requires attentiveness and agility, but when done right, the impact is unmistakable.
If you’d like to improve customer satisfaction and customer lifetime value, try the three strategies we shared in this article. You can set them up easily with a free OptiMonk account.
