Google Analytics is a critical tool for evaluating the performance of ecommerce businesses. In fact, about 87% of the top 10,000 sites use Google Analytics to collect and analyze data patterns.
You can use Google Analytics to understand how your online store is performing, which will in turn allow you to refine your ecommerce marketing strategy properly in the future.
To make Google Analytics as effective and convenient as possible, you should use the best reports for ecommerce. In this article, we’ve rounded up the 8 most important reports you’ll want to check out as an ecommerce business.
Let’s have a look!
The 8 most important ecommerce Google Analytics reports
1. Channels
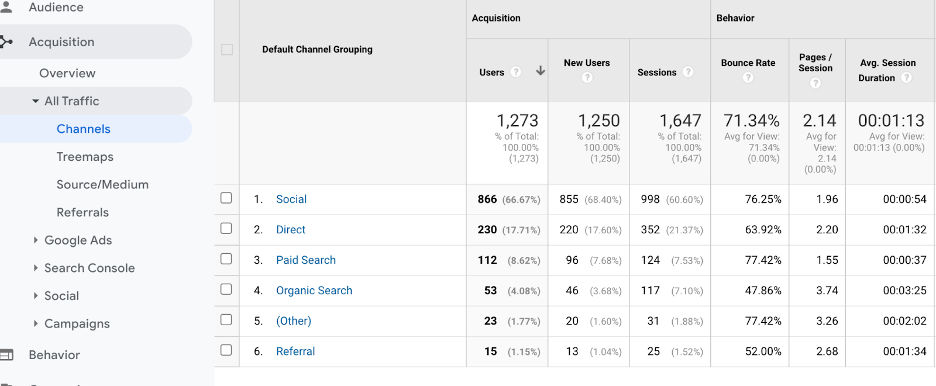
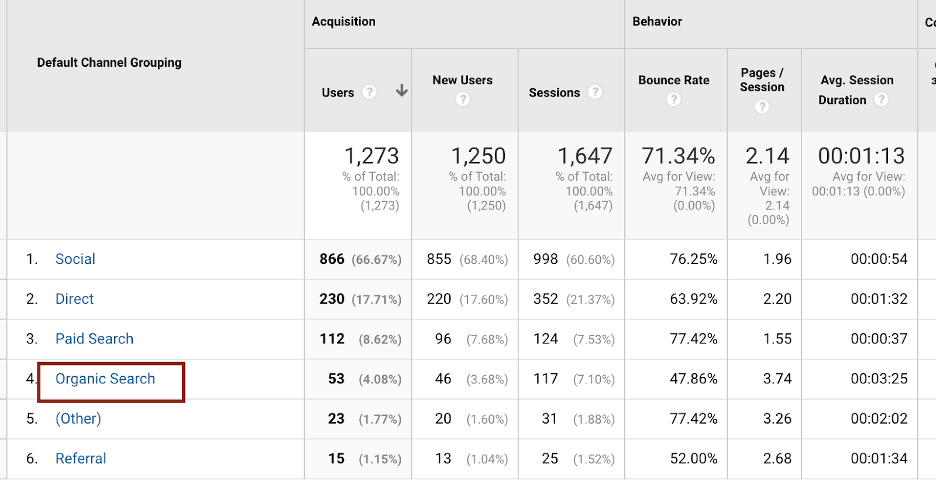
This is the most informative report. It allows you to evaluate which platforms your traffic is arriving from and calculate your ecommerce conversion rate. By discovering which platforms are most and least important, you’ll be able to tweak your strategy going forward.
To open a report, click on “Acquisition” from the menu on the left sidebar, then “All Traffic” from the submenu that appears, and then “Channels”:
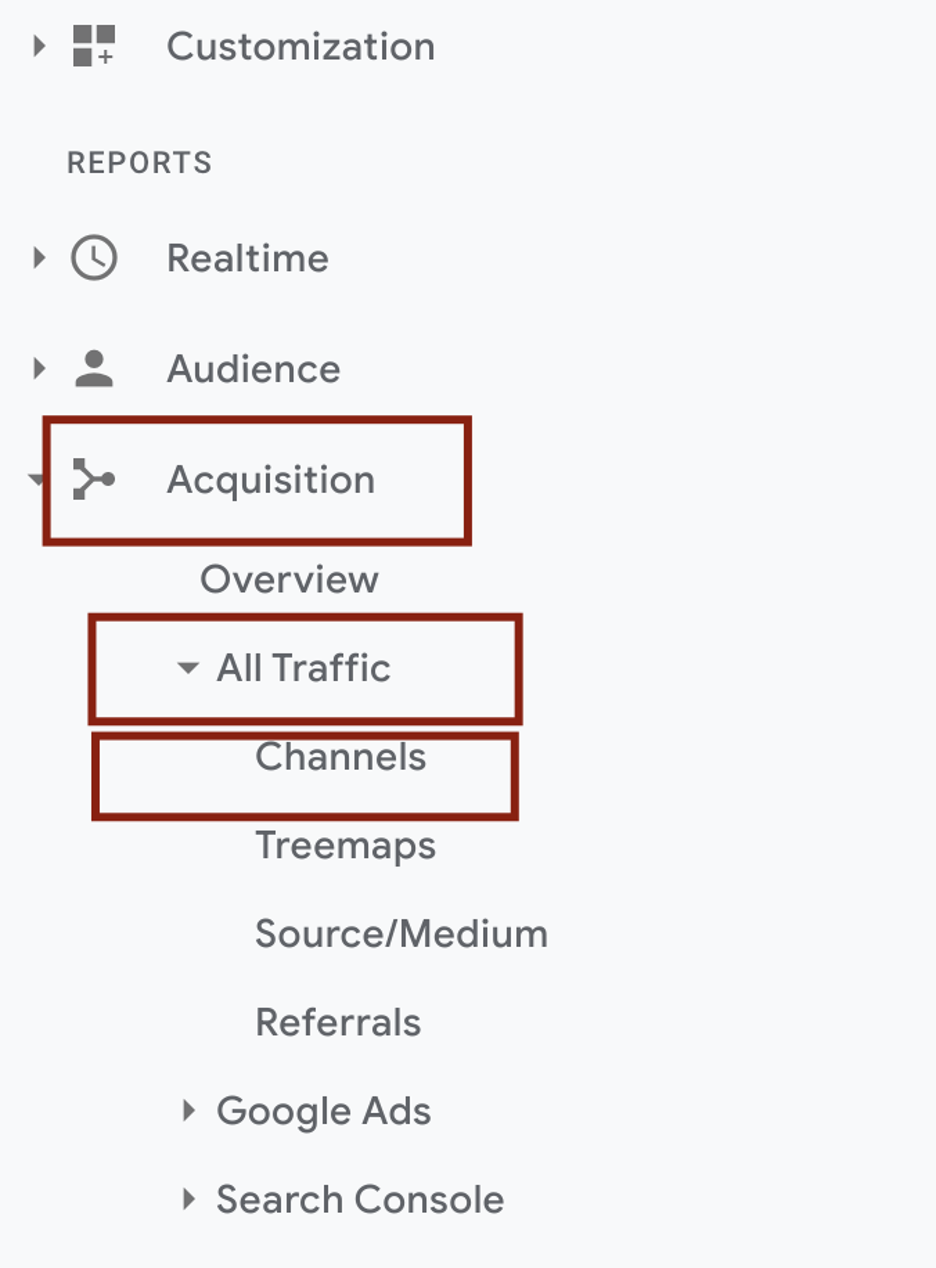
The following menu will then appear on the screen, where you’ll see stats for all the different channels:
2. Browser and OS usage statistics
Want to make sure you’re focusing on the right areas to increase your bottom line?
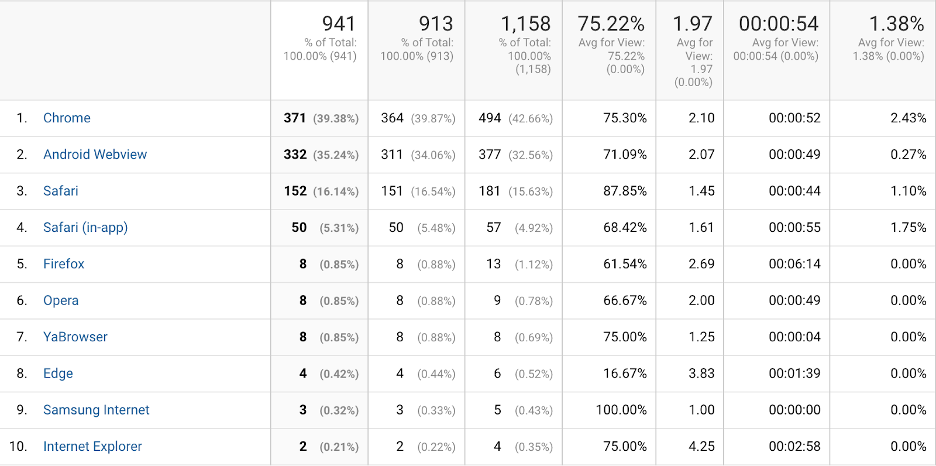
Then you’ll want to include some ecommerce analytics reports with browser and OS (operating systems) usage statistics in your arsenal.
They’ll help you figure out which browsers (and versions) bring you the most conversions, which will in turn help you discover potential improvements to your site and content. You’ll also learn which devices you get the most conversions from.
If you see that there’s a significant gap in performance from one OS to another, it means that you need to optimize the site for the operating system that’s bringing fewer conversions.
In order to generate a report for your ecommerce business, go to “Audience → Technologies → Browser and OS”:
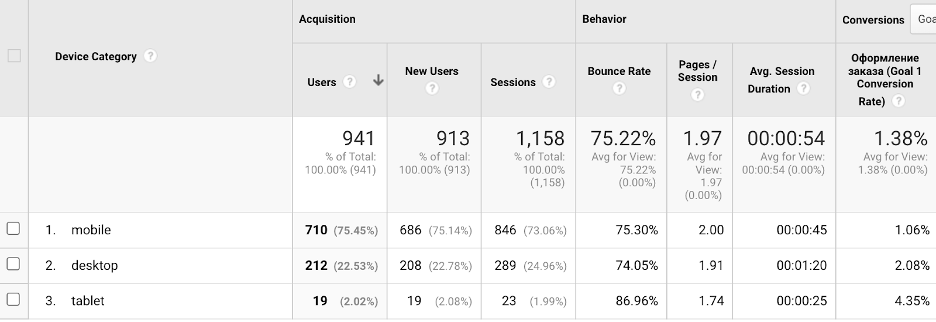
3. Mobile
Every year, more and more users prefer to surf the web on their mobile devices. Therefore, if your website’s mobile version is not user friendly enough for consumers, you may be losing sales.
This report works well in conjunction with the previous one. It allows you to confirm your hypotheses and understand which mobile users have problems along the way (and where) so you can fix them.
To do this, go to “Reports → Audience → Mobile”.
4. Organic search
Nearly 93% of online experiences start with a search engine. If you want your site to rise to the top of the search results, then search engine optimization is something you don’t want to skimp on.
To access these enhanced ecommerce reports, go to the “Organic Search” menu under “Channels.”
Then, this screen will appear:
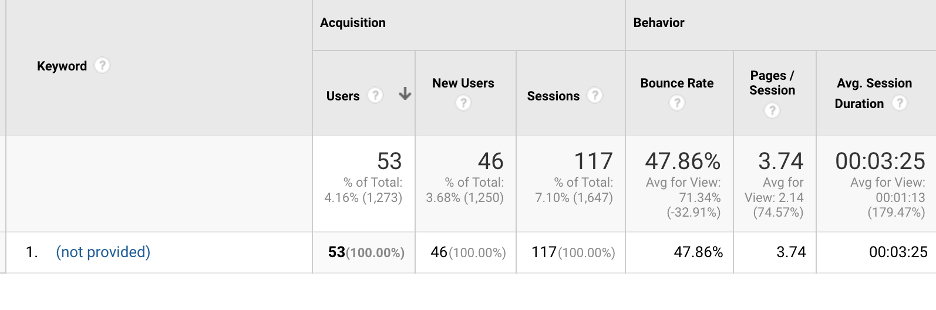
Site search data is suitable for evaluating popular and high-performing keywords. It not only shows the most effective options, but also those that aren’t working so you can swap them out for better ones.
To improve your organic website traffic, you can check out these SEO guides for two of the most popular ecommerce platforms in the US: Shopify and BigCommerce.
5. Direct traffic for ecommerce businesses
Brand awareness drives direct traffic, or users that navigate to your site using bookmarks or by entering the URL directly.
This is an important indicator, as it shows you how many people are already brand aware. The higher the level of direct traffic, the more people know about you and are ready to continue the interaction.
This Google Analytics report is available in the “Channels” menu, under “Direct”:
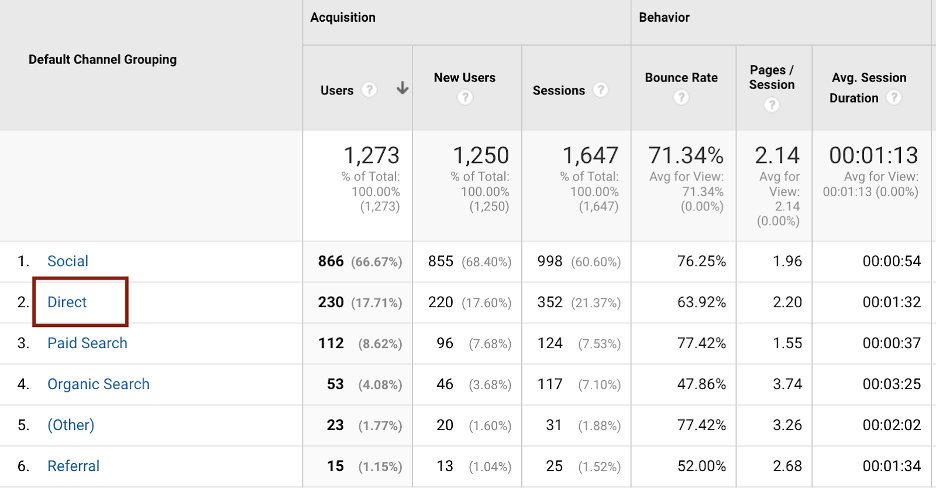
Analyze the report to understand how users come to you and to adjust your marketing efforts.
6. Landing pages
The landing page report allows you to track the actions of first-time visitors to your landing pages.
The most important indicators in the Landing Pages report for your ecommerce business are:
1. Click-through rate (CTR)
The number of clicks per page is the click-through rate (CTR=clicks/impressions*100). For example, with 1000 impressions and 50 clicks, the CTR will be 50/1000*100=5%. The higher your CTR, the better.
2. Sessions
The time a visitor stays on one page is called the “session rate.” It gives you an insight into how attractive and engaging a particular page is for the user.
You can also examine “new sessions.” The principle is the same, except that they provide data on a user’s first visit to the site. Both options are aimed at testing the attractiveness of your content, and can help you improve your landing pages to keep your users engaged.
3. Bounce rate
The percentage of users who exit your landing page as soon as they arrive is called the bounce rate. If it’s below 50%, then it’s considered “low,” and everything is in order. If it exceeds 70%, you’ll definitely want to change something to bring it down.
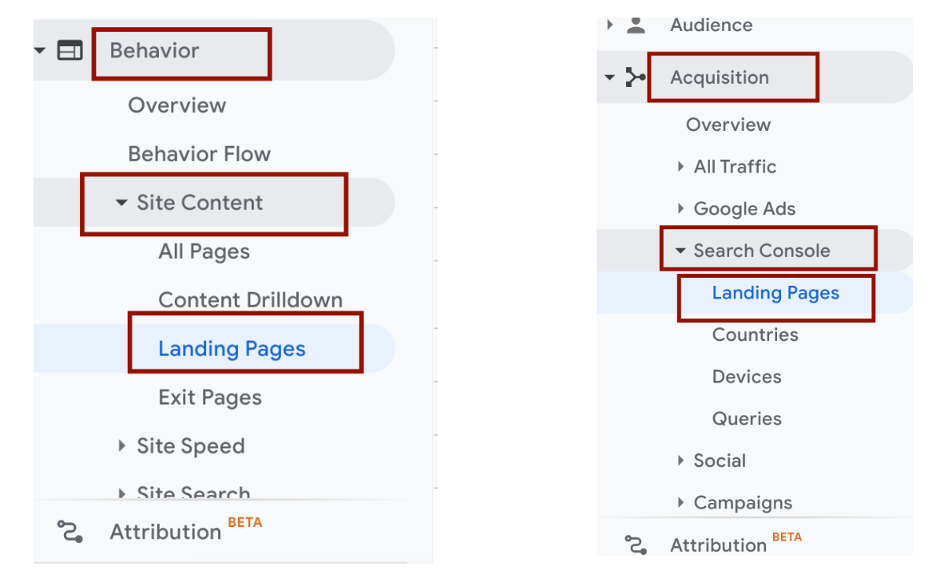
To access the report, just follow these screenshots:
7. Scheme of customer behavior
Every business owner wants to know how users move around the site and how they react to different pages. Under the “Behavior” submenu, you can evaluate customer lifetime value and use the Behavior Flow report to discover which pages visitors repeatedly visit and how they navigate your site.
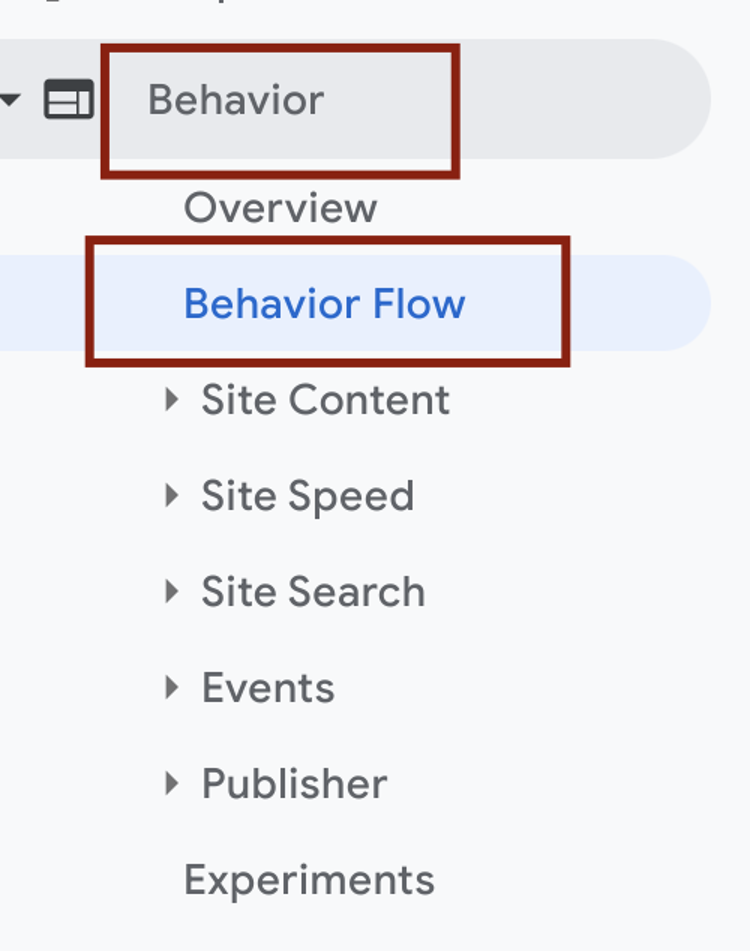
Get to the report by clicking on “Behavior,” then “Behavior Flow”:
It will look like this:
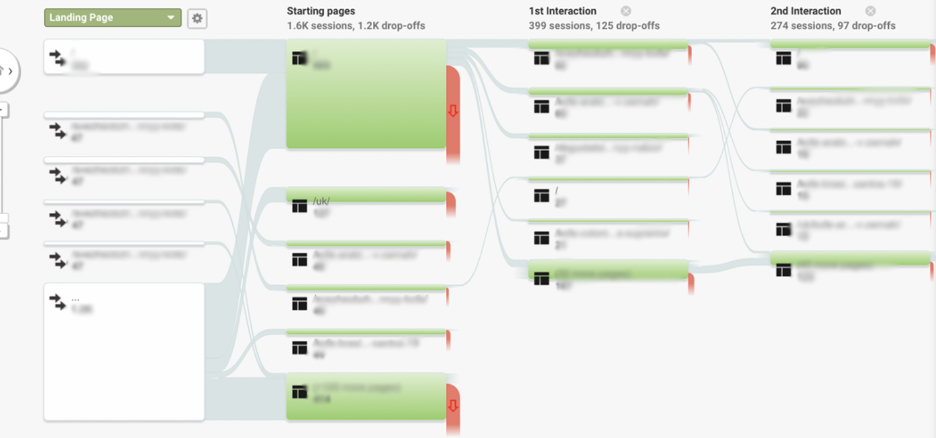
With this report, you can view the entire user journey from the moment they land on one of your pages to the moment they make a purchase or leave your site. You’ll be able to check every step and learn why users are taking certain actions.
Remember, pages with a high bounce rate need to be fixed as soon as possible. Most often, adjusting the CTA or refining the content should do the trick.
8. Conversion by the time of day
Daily user activity is one of the key metrics for ecommerce.
With it, you can select a period of time and analyze user activity. Please note that by default, Google Analytics will prompt you to view the report for the last 30 days.
Additionally, be mindful of ensuring compliance with data protection regulations. Google Analytics 4 has enhanced the compatibility and synergy between GDPR and Google Analytics, fostering an improved relationship in terms of data privacy and analytics functionality.
By understanding when your users are most active, you can plan the work of digital marketers intelligently. For example, you’ll be able to create an effective schedule for campaigns, blog posts, etc.
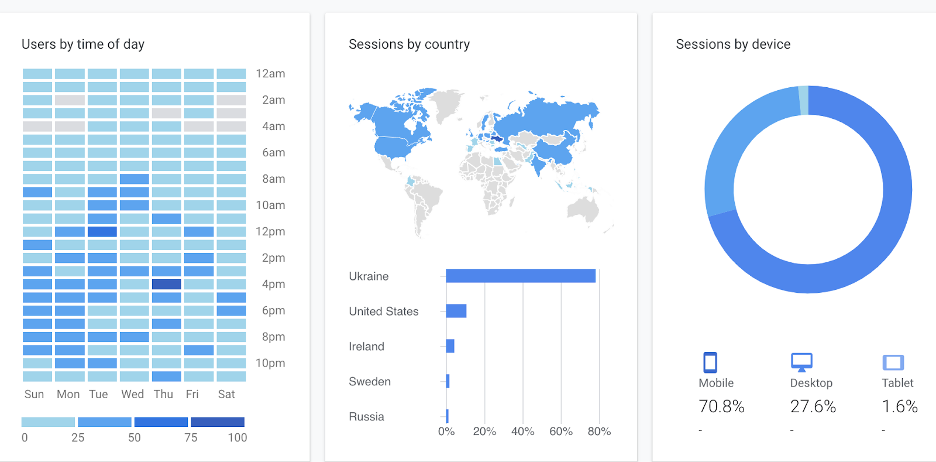
You can find the report on the main page:
Conclusion
Google Analytics remains one of the most important tools for ecommerce businesses, allowing them to both collect and analyze key data.
In this article, we’ve shared 8 Google Analytics reports that will help you understand how your site and individual pages are performing.
Use this data to increase the effectiveness of your marketing campaigns, improve the user experience, and boost sales!
Share this
Written by

Leslie Anglesey
Leslie Anglesey is a freelance writer, journalist, and author with a passion for telling stories about the economic and social situation in the world. In case any enquiry or suggestion kindly reach out to her on GuestPostingNinja@gmail.com