Running hypothesis experiments is a key part of transforming an ecommerce store from a collection of web pages into a well-oiled conversion machine.
To be sure you’re making the right moves, you have to use data to guide your decisions—otherwise, you’re just guessing and hoping for the best.
This blog post is going to get into the weeds of hypothesis testing. If you can master these techniques, your website will convert more traffic into paying customers than you ever thought possible.
Let’s jump right in!
What is hypothesis experimentation?
Hypothesis experimentation is a method of optimizing online stores to enhance customer interactions.
It’s also known as hypothesis testing, and it involves evaluating how various variables influence user behavior and conversion rates.
In essence, a hypothesis is a theory about how or why a specific effect occurs. In an ecommerce context, a simple hypothesis could be that displaying cart abandonment popups will result in a better conversion rate.
Once you have a theory like that, you can use a statistical hypothesis test to see whether what you predict (an increased conversion rate, in the above example) will actually occur.
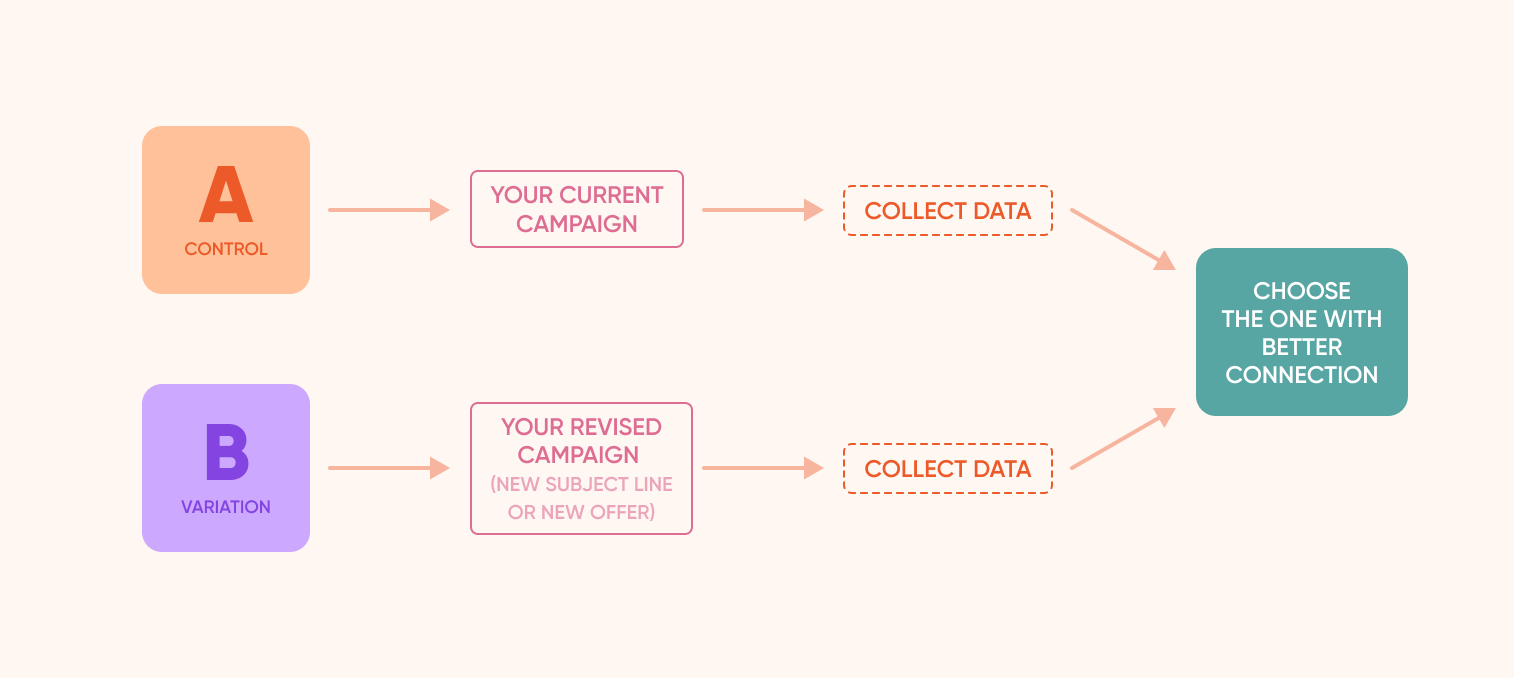
A commonly used technique in hypothesis testing is A/B testing. This is where two versions of an existing site or app are compared to determine which one performs better in terms of user engagement or conversion rate.

Statistical analysis is fundamental to hypothesis testing because it’s the only way to tell whether the effect you’ve observed is the result of something significant or simply down to random chance.
These statistical methods involve a few steps:
- Formulating a hypothesis that claims changing one variable will affect another variable.
- Formulating a null hypothesis, which states the opposite (that no significant difference will occur).
- Conducting hypothesis tests using sample data to determine the statistical power of each of your two hypotheses.
- Deciding whether to accept or reject the null hypothesis based on its statistical significance.
If we use A/B testing as an example, the null hypothesis will be that the variation you’re testing will have no effect, while the alternative hypothesis will be that the variation will cause an effect.
Performing these steps will help you separate your good hypotheses from your bad ones and avoid making changes to your site based on unreliable results that won’t hold up in the long run.
How to craft a strong hypothesis?
Knowing how to formulate a solid hypothesis is the key to getting your hypothesis testing off the ground. Here’s how to do it:
1. Utilize customer behavior insights
In order to develop strong hypotheses for testing, you need to make an effort to identify variables that will actually make a difference in how users interact with your website. In this context, a variable is an on-page element that could make a conversion more or less likely.
For example, the call-to-action on a landing page is one variable that can be responsible for low conversion rates.
A solid hypothesis could be “changing my call-to-action from ‘Buy Now’ to ‘Learn More’ will result in a higher click-through rate.”
Then, you can use hypothesis testing to look for answers to the question of whether or not that change will actually be beneficial to your business.
Finding relevant elements for testing is easier when you have a strong understanding of the psychological principles involved in modifying consumer behavior, such as loss aversion and social proof.
Various resources can be employed for gathering these insights, such as analyzing feedback surveys with open-ended questions, utilizing behavior analytics platforms, and conducting customer interviews.
2. Avoid common pitfalls in statistical analysis
One crucial aspect of avoiding errors in A/B testing is to assess the steps necessary for the successful implementation of an AB test.
This includes making sure your tests are shown to plenty of users, since a larger population increases the likelihood of obtaining accurate results.
You also need to be careful to avoid type I and type II errors:
- Type I errors, or false positives, occur when a test falsely rejects the null hypothesis.
- Type II errors, or false negatives, occur when a test fails to reject the null hypothesis when it should have been rejected.
Type I errors might lead you to believe that a variation that performs well during testing represents an actual improvement when in fact the improved performance was just random.
On the other hand, type II errors can lead you to reject promising ideas because your null hypothesis was not dismissed.
Falling into either of these traps can lead you to make changes to your site that do more harm than good. Doing your research and ensuring your hypothesis is evidence based and relevant to your business goals is the best way to minimize the risk of these errors.
How to implement hypothesis testing?
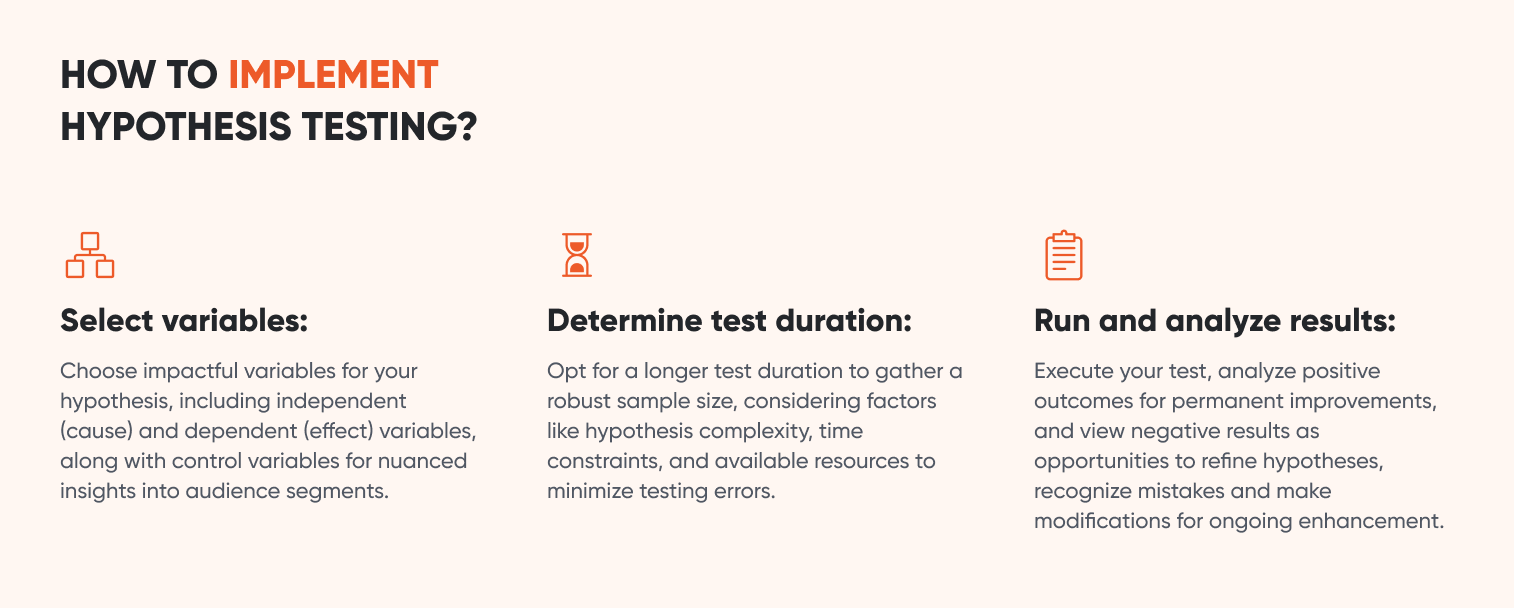
Although hypothesis testing might seem complex, you can set up tests that answer important questions by following these three steps.

1. Select variables
The initial step in carrying out hypothesis testing is choosing variables that align with your business objectives and can have a quantifiable effect on KPIs like conversion rate or user engagement.
For basic hypothesis testing, you need to select two variables:
- the independent variable (i.e. the cause), and
- the dependent variable (i.e. the effect).
You can also include control variables in your A/B tests that track the influence of other factors on your results, such as age, gender, education, and device type.
These control variables can help you understand whether certain changes lead to better results only for certain customer segments rather than your entire audience. For example, mobile users might love a change you’ve made as part of an A/B test, while the rest of your user base might feel indifferent.
2. Determine your test duration
Once you know what you want to test, it’s time to formulate a plan for carrying out the test. The most important factor to decide is the length of time you want your tests to run.
In general, a longer test is better because it allows you to gather a larger sample size (number of users who have seen one of your two versions). The larger the set of sample data you gather, the more confident you can be in the statistical significance of your test.
However, you also need to take a number of other considerations into account when you’re deciding on the duration of your hypothesis experiment, including:
- Complexity: The more complex the hypothesis you’re testing, the more data you need to gather to reach statistical significance.
- Time constraints: Are you testing a seasonal campaign that needs to be launched by a specific date, or do you have lots of time to get answers?
- Resources: What kind of resources do you have available to create and monitor your testing program?
By ensuring that your sample size and test duration are appropriate for your hypothesis testing, you’ll be able to minimize type I and type II errors.
3. Run the statistical hypothesis test and analyze your results
After all the preparation is done, it’s time to launch your test, collect data, and wait for the final results. Once the duration you’ve chosen to test for has elapsed, the next step is analyzing the results, learning from them, and refining future hypotheses.
A positive result is good news, since you’ve discovered a way to improve your website. If the statistics tell you that you should be confident in the results, you can roll out the change permanently.
A negative result is still good news, since you’ve ruled out a change that would not have improved your website. Now, it’s time to reassess your hypothesis, recognize potential mistakes or alternative explanations, and make modifications for future experiments.
By iteratively testing and refining hypotheses based on experimental results, you can continuously improve your ecommerce strategies and enhance customer satisfaction.
FAQ
What is a null hypothesis?
A null hypothesis serves as the foundation for statistical analysis in A/B testing, allowing you to discern the statistical significance of the effect you’ve observed. This involves testing the difference between two hypotheses in terms of their standard deviation, confidence interval, and p-value. If your null hypothesis is not supported as well as your primary hypothesis (which predicts an effect based on changes to variables), the effect that you’ve observed will have a higher significance level.
What is hypothesis testing in statistics?
In statistics, hypothesis testing is a way of gathering and analyzing quantitative data through a reliable process that ensures the accuracy of your results. For example, if you want to know whether a cart abandonment popup will affect your exit rate, hypothesis testing provides a robust framework for gathering and analyzing data.
Wrapping up
Integrating hypothesis testing into your own best practices is a great way to grow your business sustainably. While constantly A/B testing and experimenting with alternative hypotheses can seem like a lot of manual work, using an advanced A/B testing tool (especially one that leverages machine learning) can help you create and run hypothesis tests much more efficiently.
OptiMonk has built AI-powered experimentation tools that are tailor-made for ecommerce stores. Request a demo and start using science to optimize your landing pages, product pages, and on-site messaging!


