- Blog
- Survey Scales: Which Survey Response Scale Works Best for You? (With Examples)
Survey Scales: Which Survey Response Scale Works Best for You? (With Examples)
-
Nikolett Lorincz
- Marketing
- 6 min read
Table of Contents
Looking to gather feedback from your customers? Surveys and questionnaires got your back.
However, even with the availability of many survey software and tools to create surveys — they can be challenging to put together. You gotta pick the right folks, ask the right stuff, and yeah, nail those answer options.
Creating survey response scales is both an art and a science. In this article, we’ll cover the most commonly used survey response scales and take a look at some of the widespread benefits of using them.
Ready? Let’s roll.
What are survey response scales?
First, let’s cover the basics: what are survey response scales?
Think of them as the yardsticks of your survey, helping survey respondents measure their opinions or experiences.
Basically, they’re the range of options you give to participants to respond to your questions. It’s like offering them a menu of choices to pick from.
These scales can be simple, like a yes or no, or more complex, with a range of options.
They help standardize responses, making it easier to analyze and draw conclusions from the data.
8 types of survey response scales
There are many different survey software and scales to choose from for your questionnaires and feedback forms.
Ecommerce websites use multiple variations of combinations on response scales depending on the goal of the survey.
Let’s review some of the most commonly used survey scales!
1. Dichotomous scale
A dichotomous scale uses two choices that are the exact opposites. The two choices are in sharp contrast with each other.
Respondents don’t have an option to be neutral with dichotomous scales.
For example:
- “Yes” or “No”
- “True” or “False”
- “Agree” or “Disagree”
- “Satisfied” or “Dissatisfied”

2. Linear numeric scale
In this response scale, the survey participants or respondents have to choose a numeric response to a specific question.
Linear numeric scales are widely used for customer satisfaction surveys and product feedback questionnaires. The most famous use of the linear numeric scale is the Net Promoter Score (NPS).

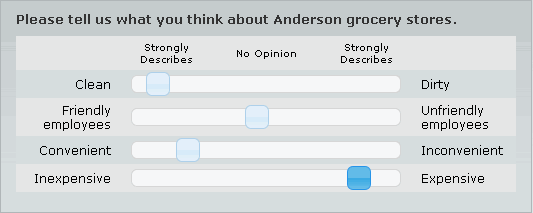
3. Semantic differential scale
Semantic differential scales ask the respondents to choose a specified rating between two extreme choices.
Unlike the dichotomous scale, where the respondents can only choose between two options, they can select a value between the two choices here in the semantic differential scale.
It helps gauge a more accurate sense of the participant’s true intentions.
4. Likert scale
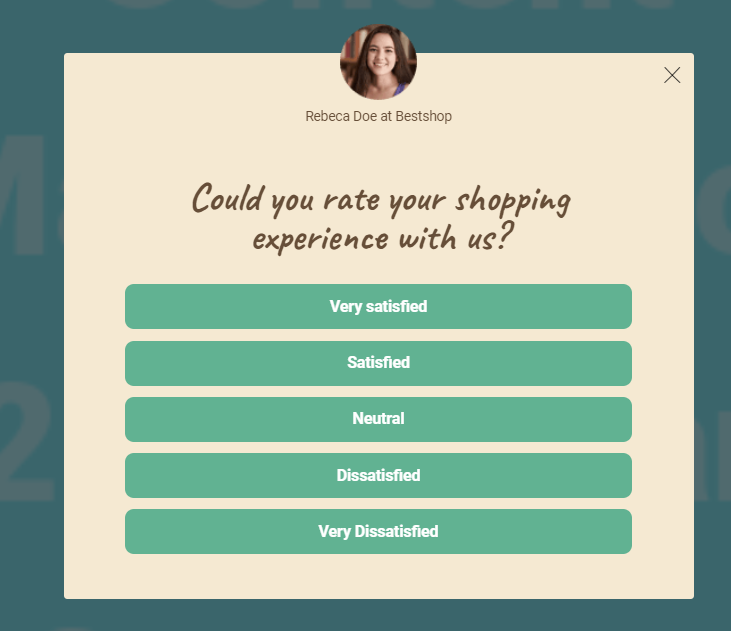
The most commonly used survey scale question is the Likert scale, named after its inventor Rensis Likert.
The Likert scale asks the survey participants how much they agree or disagree on a statement.
Typically, Likert scales use a 3-point or 5-point system, meaning there are three to five choices to pick from.
Likert scale questions usually have the following options:
- Very satisfied, satisfied, neutral, dissatisfied, very dissatisfied.
- Strongly agree, agree, neither agree nor disagree, disagree, strongly disagree.
To effectively use Likert scales in surveys, consider the following additional tips:
- Label the scale: To assist survey respondents in understanding the ranking scales, provide clear and meaningful labels for each point on the Likert scale. Using numbers alone might confuse participants, so ensure that the labels convey the sentiment associated with each endpoint of the scale.
- Choose an odd number of scale points: Opt for an odd number of scale points to include a neutral point in the middle. Research suggests that scales with more than seven options can overwhelm respondents, leading to random selections that could compromise the data quality. Aim for five scale points for a unipolar scale and seven scale points for a bipolar scale.
- Maintain equal spacing between response options: To ensure the consistency and accuracy of responses, make sure that the intervals between the scale points are evenly distributed. Whether using numerical or verbal labels, maintaining equal spacing helps participants understand the gradation of responses.
- Cover the full range of responses: Ensure that the Likert scale captures the entire spectrum of possible responses to the survey question. This inclusivity enables participants to adequately express their opinions or experiences without feeling restricted by the options provided.
- Implement skip logic: Save time for survey respondents by incorporating skip logic in your surveys. By setting up skip logic based on certain criteria, such as respondent selections, you can direct participants to relevant follow-up questions, streamlining the survey process while gathering more detailed feedback from those who meet specific conditions.
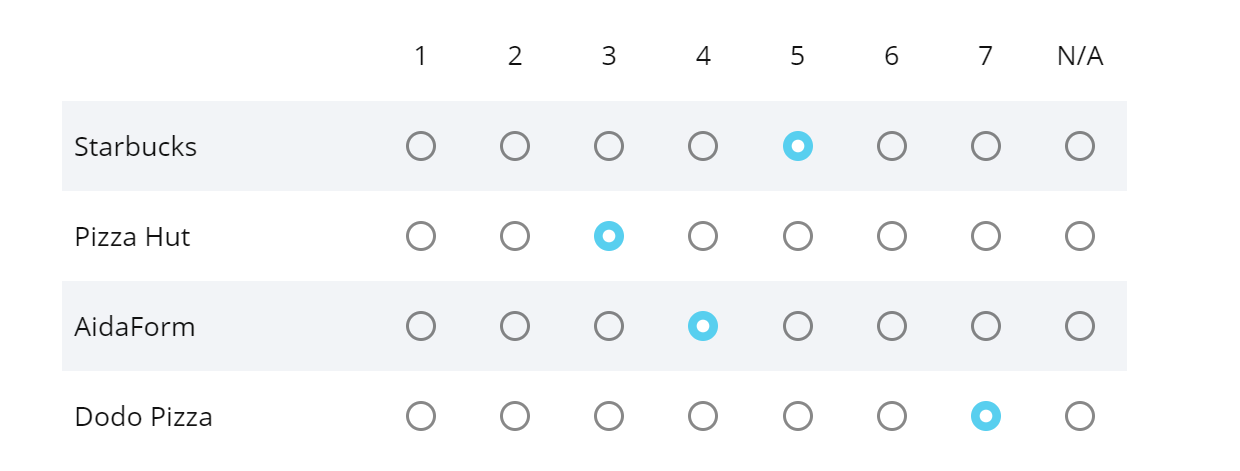
5. Multiple rating matrix
In this rating scale, respondents have to choose an option for multiple grouped questions.
This survey scale is similar to the Likert scale. However, choice selections are more open and flexible than Likert.
Here’s an example with simple numeric choices.
And here’s another example with more specific choices. Instead of radio buttons, the survey participants can choose multiple answers to the same questions.

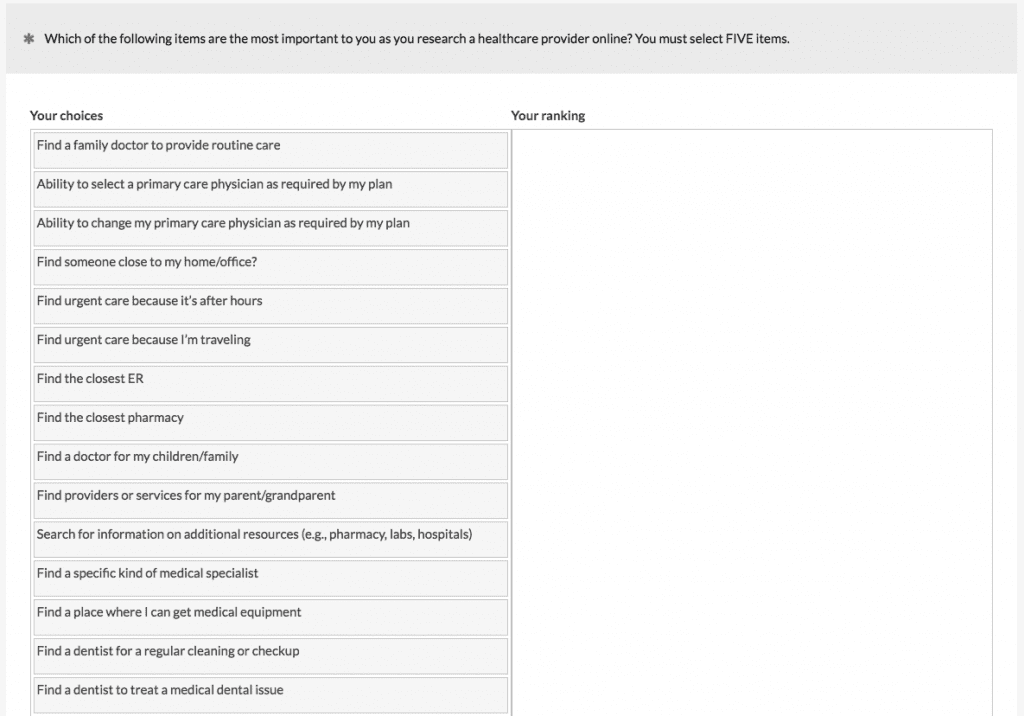
6. Pick some
Also known as Top Task Analysis — this survey scale asks the respondents to select the top three or five choices directly relevant to them.
The researcher then compiles all the respondents’ answers and can then determine the most important features or priorities.
This type of survey can be used for product feature recommendations or during sales discovery calls.
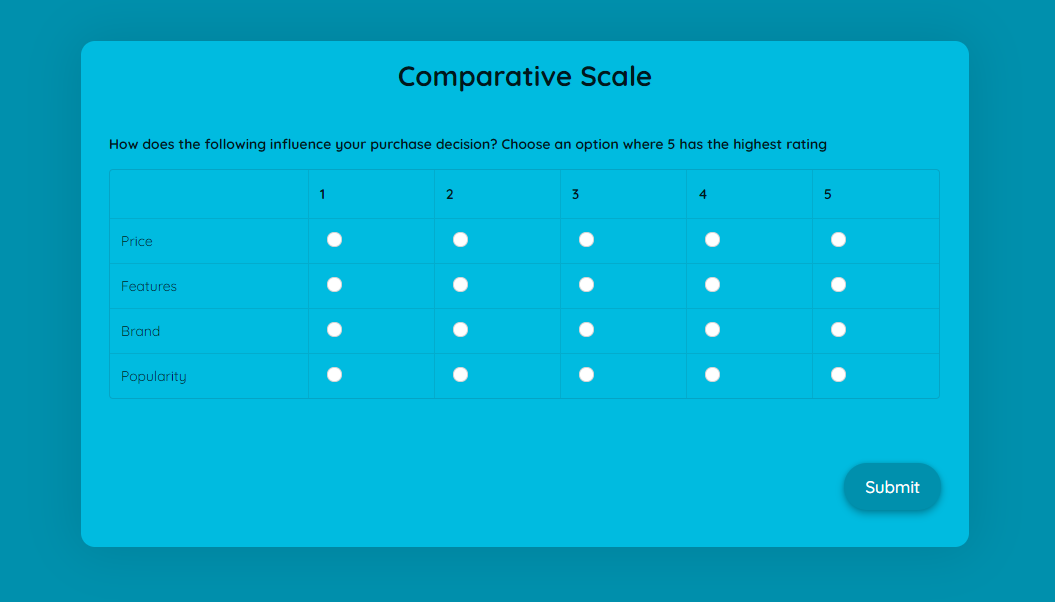
7. Comparative rating scale
This rating scale is used to measure a survey participant’s responses based on specific benchmarks.
For example, if you wanted to find out some of the essential characteristics the respondent bases his/her decision on, you would use this scale.
Let’s say you are trying to determine whether the purchasing decision will be based on price, quality, or both — you will use this rating scale.
8. Graphic rating scale
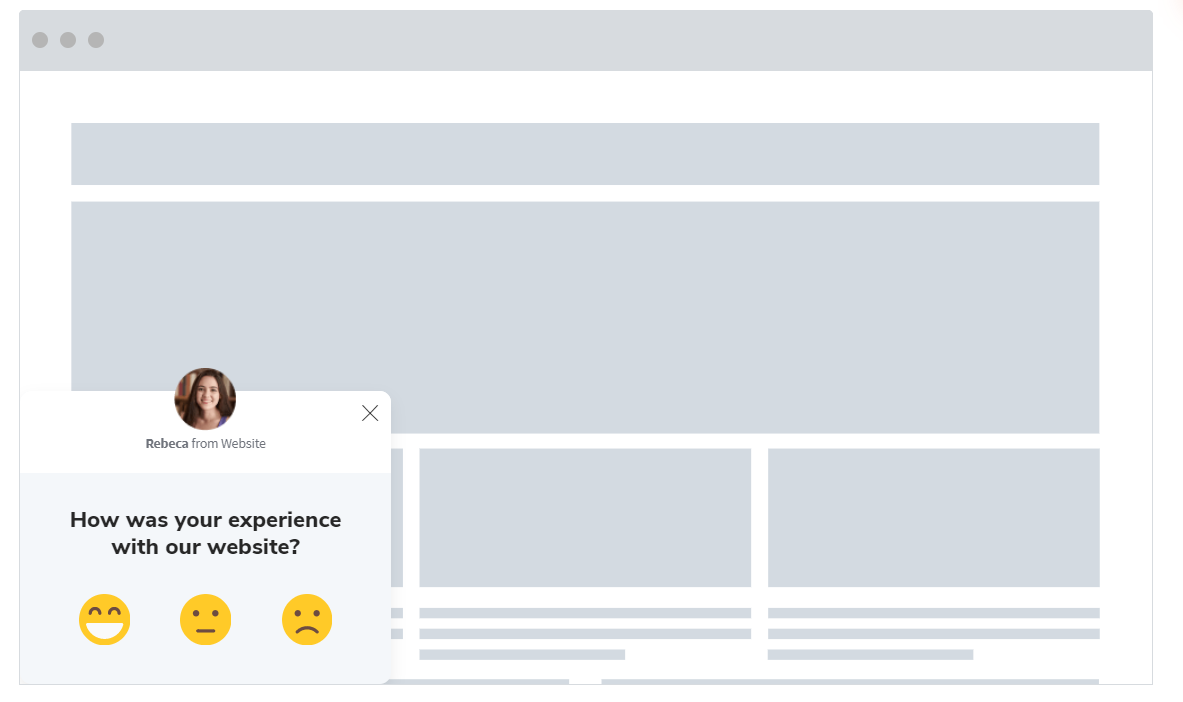
This survey response scale uses pictures of graphics instead of numbers or words. Because of its interactivity, it’s widely popular amongst ecommerce stores.
5 benefits of survey ratings scales
There are many widespread benefits of using survey rating scales. Hence their popularity in the B2B marketing and ecommerce space.
Let’s review some of the benefits:
1. Generate leads: Using a survey rating scale is an excellent way to convert website website visitors into leads.
By asking a relevant question, you can then guide them down a customer journey path that’s personal and relevant.
2. Improve employee satisfaction: To keep your employees continually engaged and improve your workplace culture, it’s essential to learn what you can improve in your company.
Incorporating corporate gifts as a token of appreciation can significantly enhance employee morale and foster a positive environment.
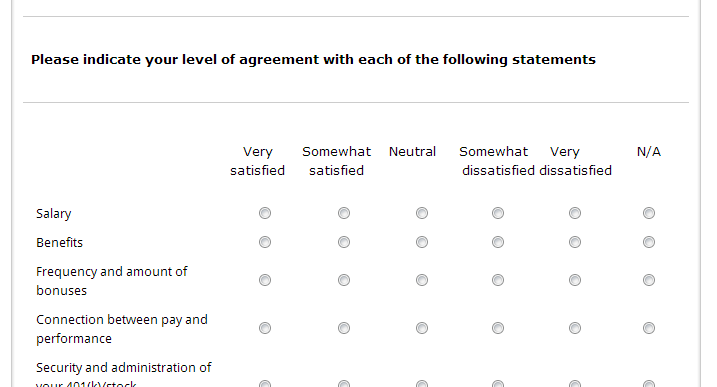
HR teams periodically used Employee Satisfaction Surveys to understand where the company is excelling and improving and whether the existing HR policies and procedures are effective or not.
Many companies integrate tools such as HR software to improve those procedures, or an HR portal, to improve those procedures.
Implementing a comprehensive Human Resource Payroll System streamlines payroll management, ensuring accuracy and efficiency.
3. Collect subscribers: Building an email list is an effective way to generate more leads, convert more customers, and build a loyal following.
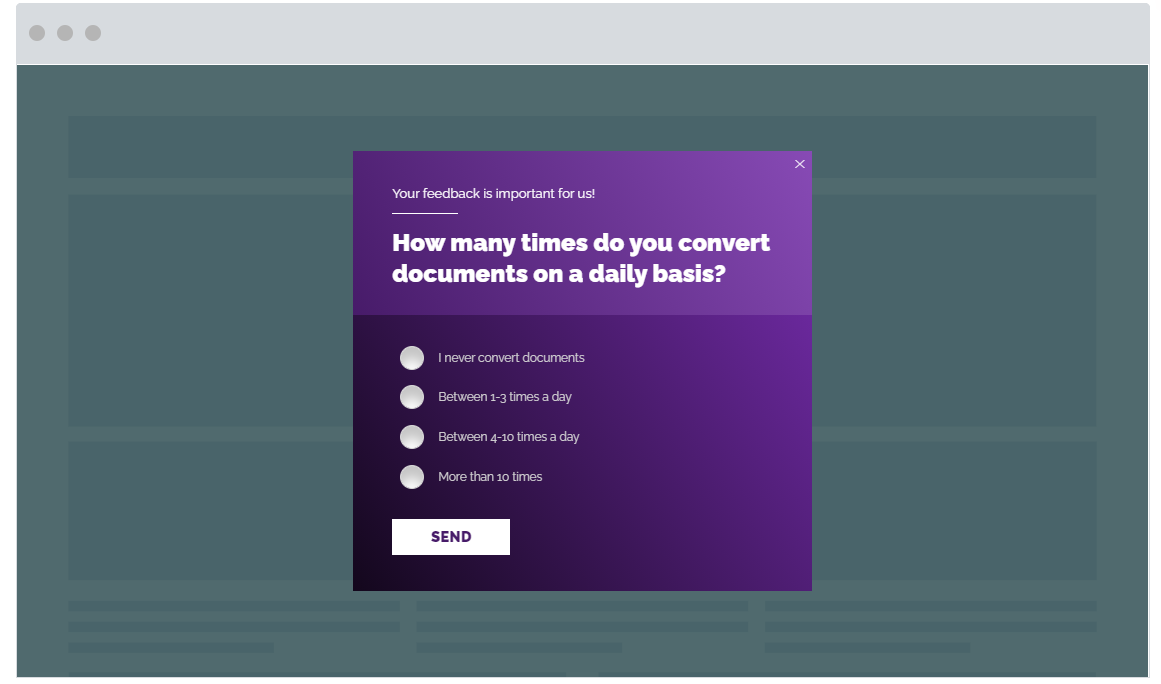
For example, you can use dichotomous scales to convert more of your visitors into subscribers.

4. Get recommendations for your product: Many times, you don’t have the resources to have a meeting or phone call with each customer to understand how you can improve your product.
Survey rating scales can be effectively used to collect product feedback and recommendations from your visitors and customers.
You can choose to display the survey questions directly on your website or your platform. Or you can send them an email survey to gain further insights. You can then compile all the survey participants’ answers and ascertain which product features you need to improve or add.
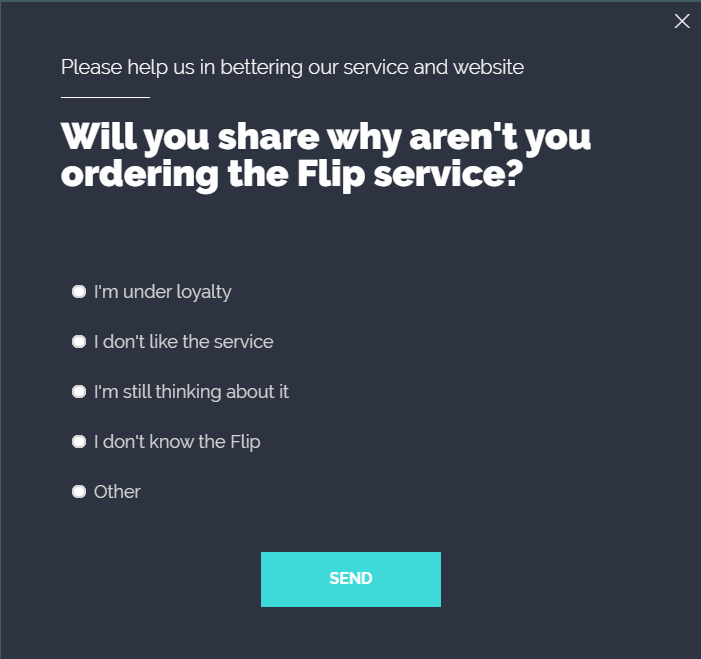
5. Collect new ideas: Survey rating scales can also collect new ideas to improve your website, product, or customer satisfaction.
Like a “suggestion box”, you can provide an open-ended survey where the respondent can fill out their answer instead of choosing from an existing list of questions.

How to choose your survey ranges?
Once you have identified who your survey participants are and also have chosen the right response scale, you must select the proper survey ranges.
The quality of your survey questions will make it easier for your respondents to answer them. Moreover, it will also help you collect the best data possible.
The survey ranges depend on the goal of your survey. Usually, customer satisfaction, employee satisfaction, and NPS surveys are more comprehensive and require multiple data points.
Website feedback or product feedback surveys are not typically detailed and sometimes include as little as one question.
Another critical factor is sensitivity and confidentiality.
Asking for demographic questions or financial questions may put the participants in unease. They might skip those questions or choose not to respond. In scenarios like this, add ranges instead of a number.
Wrapping up
You now have a basic understanding of response scales. Before you launch your next survey, here are a few more things to keep in mind.
- Reduce the use of metric scales that strictly rely on numbers (0-10). The challenge is that you will not be able to collect qualitative insights.
- Provide open-ended options wherein your customers can provide detailed answers. For example, if you want to improve on your NPS and Customer Satisfaction Score — give them a chance to explain why they chose a “Strongly disagree” or “Dissatisfied” response.
- Don’t make your survey rigid by requiring the completion of each question. Make some of the questions optional.
Creating survey questions and ranges shouldn’t be that complicated. Collecting the right information and feedback will help you make improvements to your product and customer service. It can also help you collect more subscribers and generate more leads.
If you’d like to get started with collecting feedback on your website, try OptiMonk popups:
Migration has never been easier
We made switching a no-brainer with our free, white-glove onboarding service so you can get started in the blink of an eye.
What should you do next?
Thanks for reading till the end. Here are 4 ways we can help you grow your business:
Boost conversions with proven use cases
Explore our Use Case Library, filled with actionable personalization examples and step-by-step guides to unlock your website's full potential. Check out Use Case Library
Create a free OptiMonk account
Create a free OptiMonk account and easily get started with popups and conversion rate optimization. Get OptiMonk free
Get advice from a CRO expert
Schedule a personalized discovery call with one of our experts to explore how OptiMonk can help you grow your business. Book a demo
Join our weekly newsletter
Real CRO insights & marketing tips. No fluff. Straight to your inbox. Subscribe now
Nikolett Lorincz
- Posted in
- Marketing
Partner with us
- © OptiMonk. All rights reserved!
- Terms of Use
- Privacy Policy
- Cookie Policy
Product updates: January Release 2025


