- Blog
- 27 Ecommerce Conversion Rate Optimization Statistics You Need to Know in 2025
27 Ecommerce Conversion Rate Optimization Statistics You Need to Know in 2025
-
Nikolett Lorincz
- Conversion
- 6 min read
Table of Contents
Ever wonder how your ecommerce store stacks up against the competition? Curious if your average ecommerce conversion rate, average order values, and bounce rates are up to par?
You’re not alone.
Many online store owners and digital marketers are constantly on the lookout for benchmarks they can use to measure their performance.
That’s why we’ve analyzed our own data from 18,000 ecommerce websites over the past year and compiled the most critical conversion rate optimization statistics for 2025. By understanding these key metrics, you can refine your marketing strategies and boost your online sales.
Let’s jump in!
TL;DR
If you don’t have time to read the whole article, here’s a quick rundown of the 27 ecommerce conversion rate optimization statistics for 2025:
- Average conversion rate: 1.81%
- Average conversion rate from social media: 0.91%
- Average conversion rate from search engines: 1.55%
- Average order value (AOV): $168.64
- Average order value on desktop: $230.2
- Average order value on mobile: $145.49
- Average order value in the Autos & Vehicles category: $866.29
- Average order value in the Travel category: $475.58
- Average add-to-cart rate: 2.34%
- Average bounce rate: 59.92%
- Average bounce rate on WordPress sites: 74.33%
- Average bounce rate on Drupal sites: 73.42%
- Average bounce rate on Shopify sites: 57.66%
- Average bounce rate on BigCommerce sites: 57.3%
- Average bounce rate on Magento sites: 51.25%
- Average bounce rate from email traffic: 54.37%
- Average bounce rate from social traffic: 63.89%
- Average cart abandonment rate: 70.32%
- Average cart abandonment rate from social media: 77.54%
- Average cart abandonment rate from search engines: 63.81%
- Average cart abandonment rate from direct traffic: 69.39%
- Average pageviews per session: 3.27
- Average pageviews per session from social media: 2.78
- Average pageviews per session from search engines: 3.48
- Traffic from search engines: 30.81%
- Traffic from direct traffic: 30.41%
- Traffic from social media: 19.94%
Alright, now let’s cover each of these conversion rate optimization statistics in more detail.
What's the average conversion rate?
Based on our research, the average conversion rate across all ecommerce businesses is 1.81%. That means that out of every 100 visitors, nearly two make a purchase.
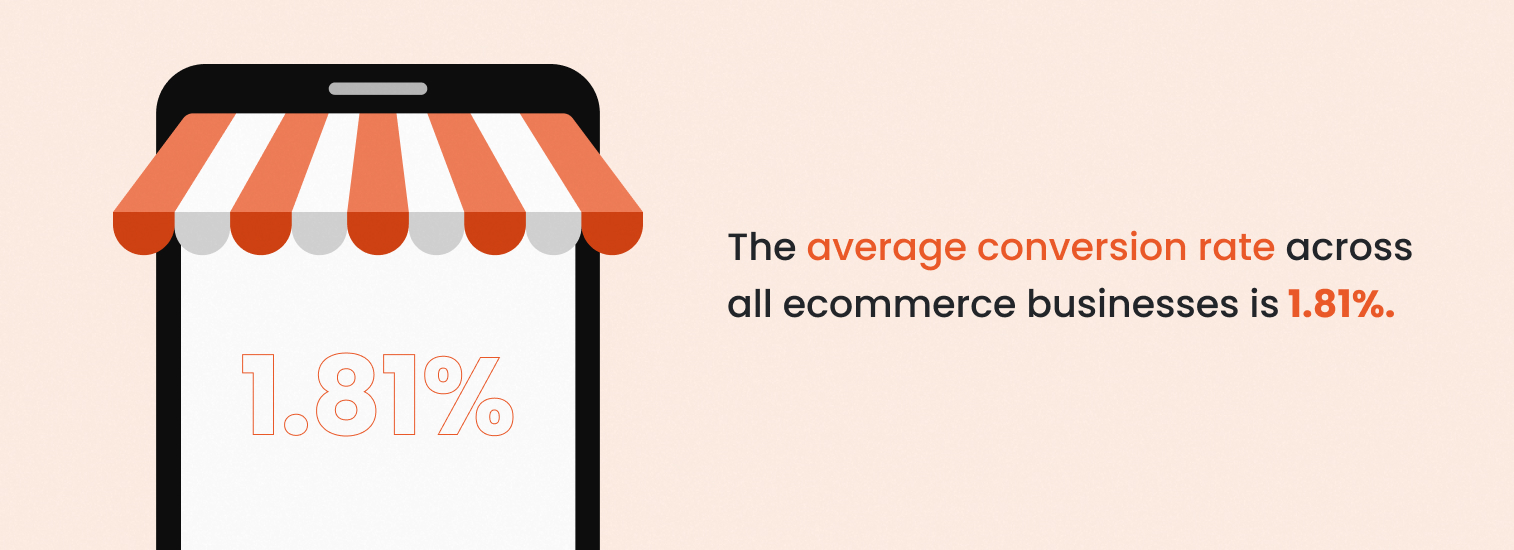
Of course, your conversion rate can depend on various factors such as industry, product type, company type (B2B, B2C, D2C), and the age of your online store.
If your store’s conversion rate is below this average, it’s time to dig deeper into your digital marketing strategy. Analyze your user experience, checkout process, and marketing efforts to identify areas for improvement.
A low conversion rate signals that you need to refine your approach to turn more website visitors into customers.
But even if your conversion rate is above the average, you can’t just sit back and relax. Let’s be honest—1.81% isn’t exactly a home run. This underscores the importance of continuous conversion rate optimization (CRO). Even small improvements can lead to significant gains in sales revenue.
Conversion rate optimization is crucial for maximizing the value of your existing website traffic. By making data-driven changes to your site, you can enhance the user experience, reduce friction in the buying process, and ultimately boost conversions.
If you’re new to conversion rate optimization, don’t worry! We’ve got you covered with our detailed guide on CRO, which will help you understand the basics and implement effective strategies to improve your conversion rates.
Average conversion rate by traffic source
Keep in mind that different traffic sources convert at different rates, and understanding this can help you tailor your marketing efforts effectively.
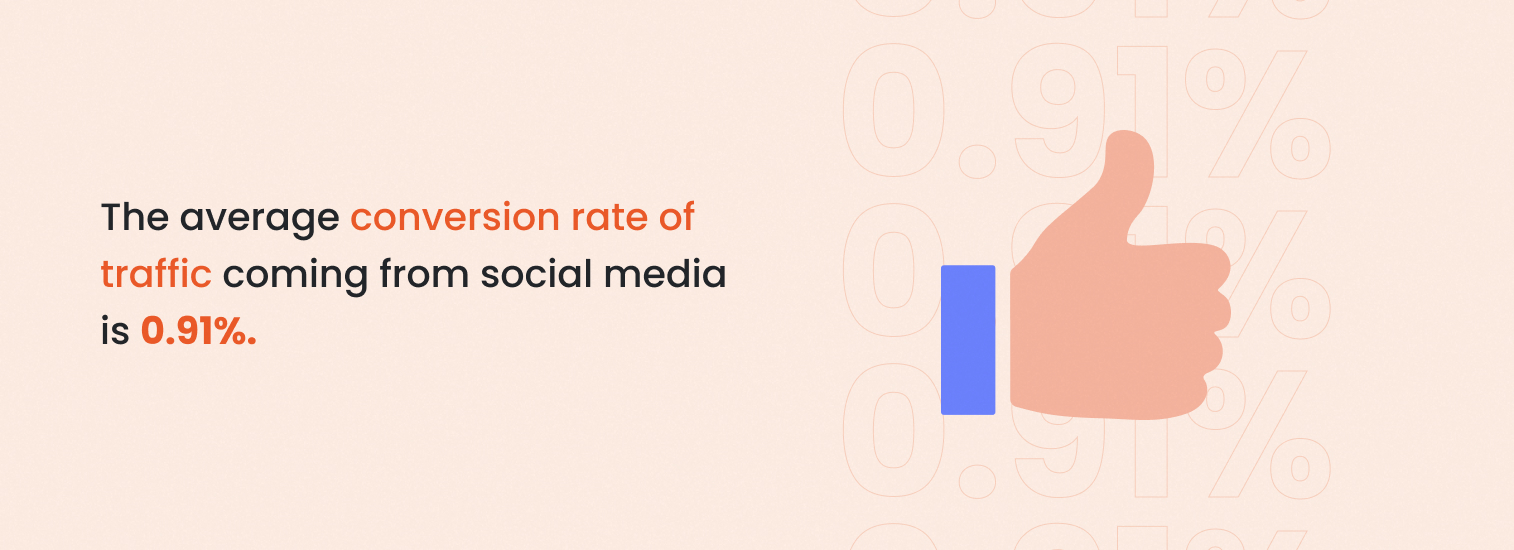
For example, social media clearly lags behind other sources, with the lowest conversion rate at just 0.91%. This lower rate might be due to social platforms’ casual browsing nature, where users are less intent on making immediate purchases.
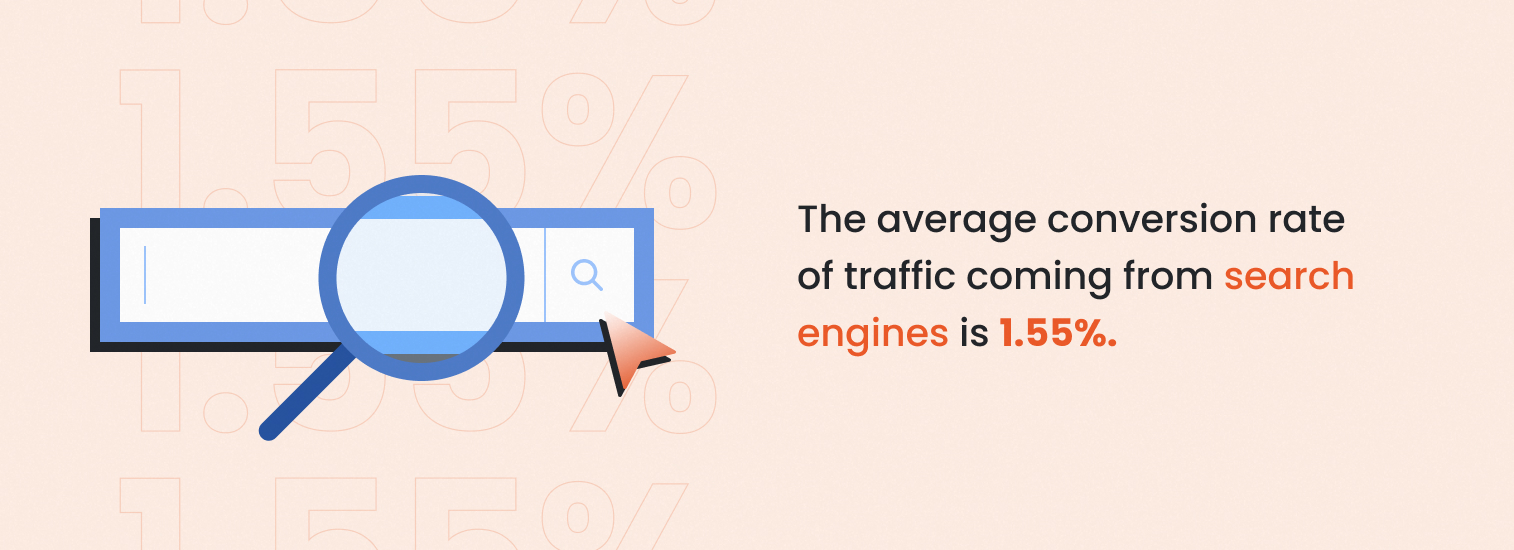
Traffic from organic search has a higher conversion rate than social media, at 1.55%, but it’s still below the average conversion rate.
Don’t let these numbers discourage you from focusing on social media or search engines. Instead, use them to guide your conversion rate optimization efforts.
Here’s how:
- For social media: Given the lower conversion rate, it’s essential to create highly engaging and relevant landing pages. Focus on compelling visuals and clear calls-to-action so you can capture the attention of social media users.
- For organic traffic: Since these users are already looking for specific products or information, ensure that your landing pages are optimized for the keywords that bring them in. Make the purchasing process as seamless as possible to capitalize on their intent.
It’s also crucial to consider the conversion rates across different devices, including mobile devices, as they often have lower conversion rates compared to desktop and tablet devices.
What's the average order value?
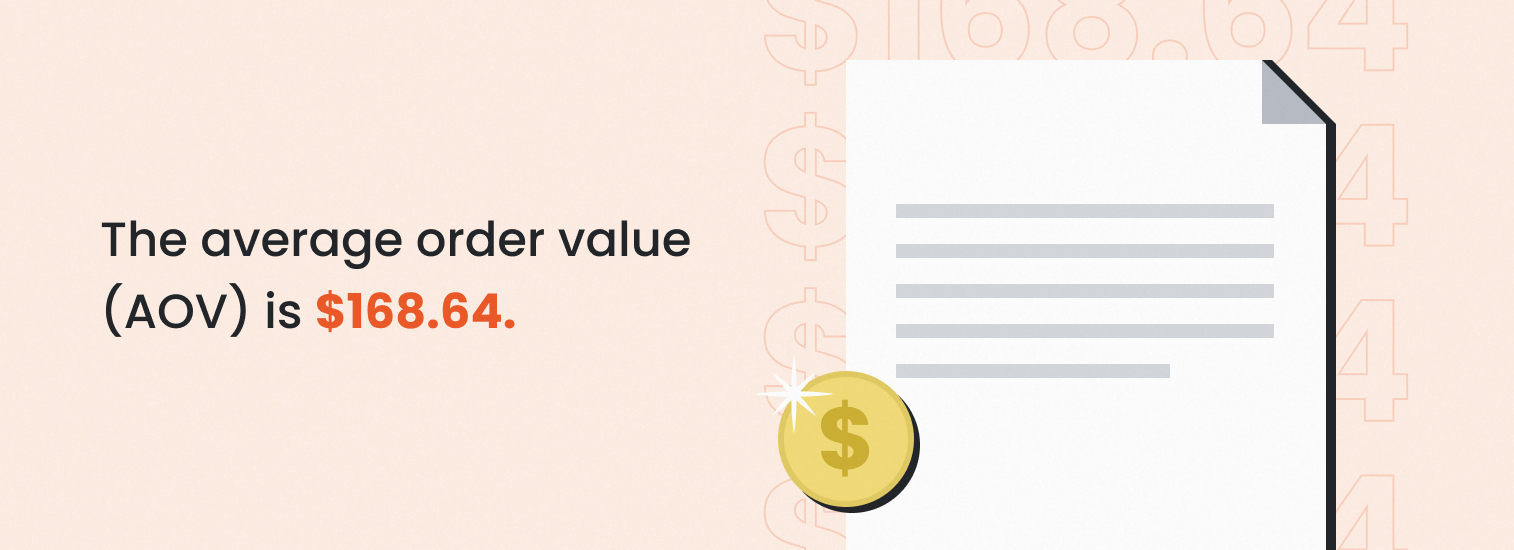
The average order value (AOV) stands at $168.64.
This metric shows the average amount spent each time a customer places an order on your site. A higher AOV often means more revenue per sale, making it a key metric to watch.
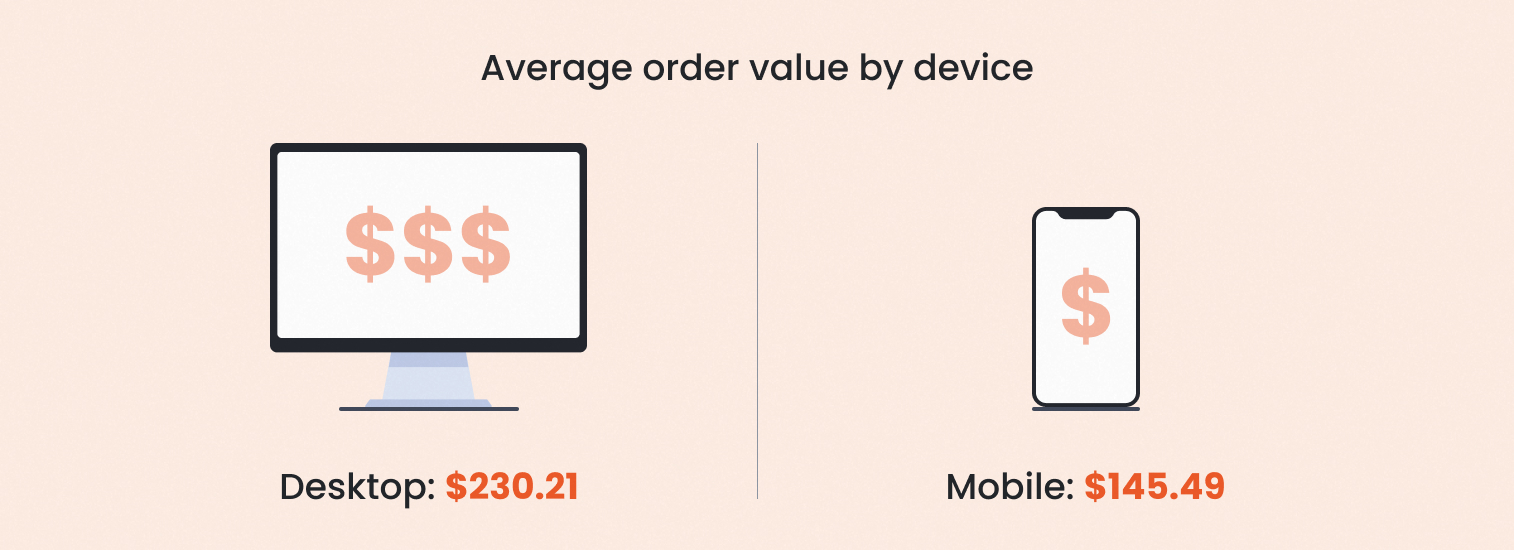
Average order value by device
Device type affects AOV significantly:
- Desktop: $230.21
- Mobile: $145.49
Clearly, desktop users tend to spend more per order compared to users on mobile devices. This might be due to the convenience of browsing and purchasing on a larger screen.
If you’re looking for opportunities to increase your average order value, optimizing the desktop shopping experience could be effective.
Focusing on strategies to increase conversions, such as upselling and cross-selling, can also help boost your average order value.
Average order value by category
Certain categories have notably higher AOVs, for example:
- Autos & vehicles: $866.29
- Travel: $475.58
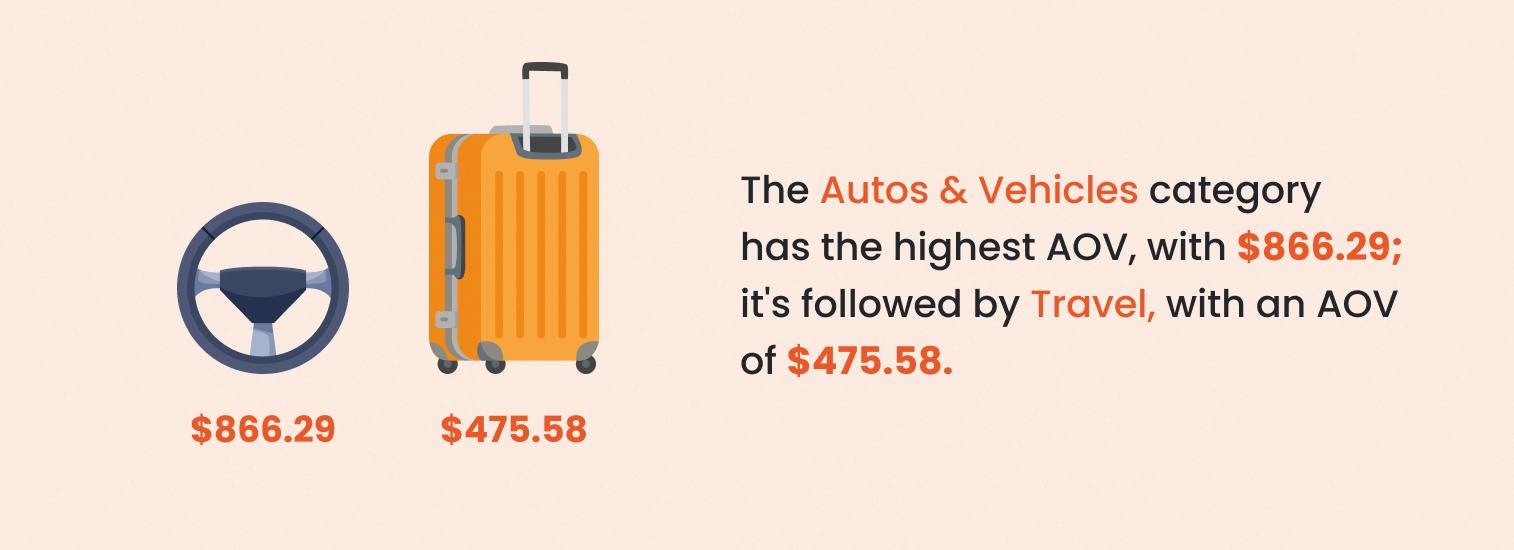
If you’re in one of these high-AOV categories, capitalize on the tendency for higher spending by offering premium products and services.
What's the average add-to-cart rate?
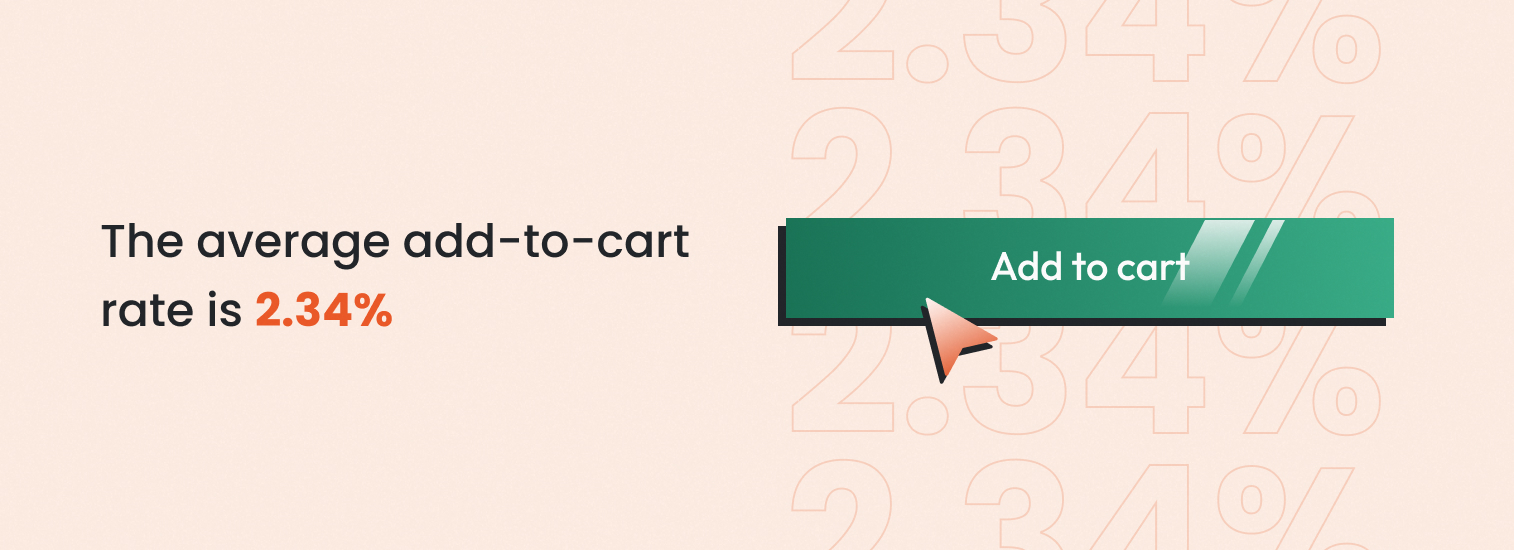
The average add-to-cart rate is 2.34%.
This percentage reflects the number of visitors who add items to their cart compared to the total number of visitors. Improving this rate can lead to more potential sales down the funnel.
Implementing personalized product recommendations can help maximize conversions and improve the add-to-cart rate.
You can display relevant product recommendations on exit pop-ups, like Lammle’s did in the example below. Thanks to this strategy, they achieved a 26.3% increase in revenue.

Here are some product recommendation popup templates that you can set up in just a few minutes:
What's the average bounce rate?
Bounce rate measures the percentage of visitors who leave your site after viewing only one page. The average bounce rate for e-commerce sites is 59.92%.
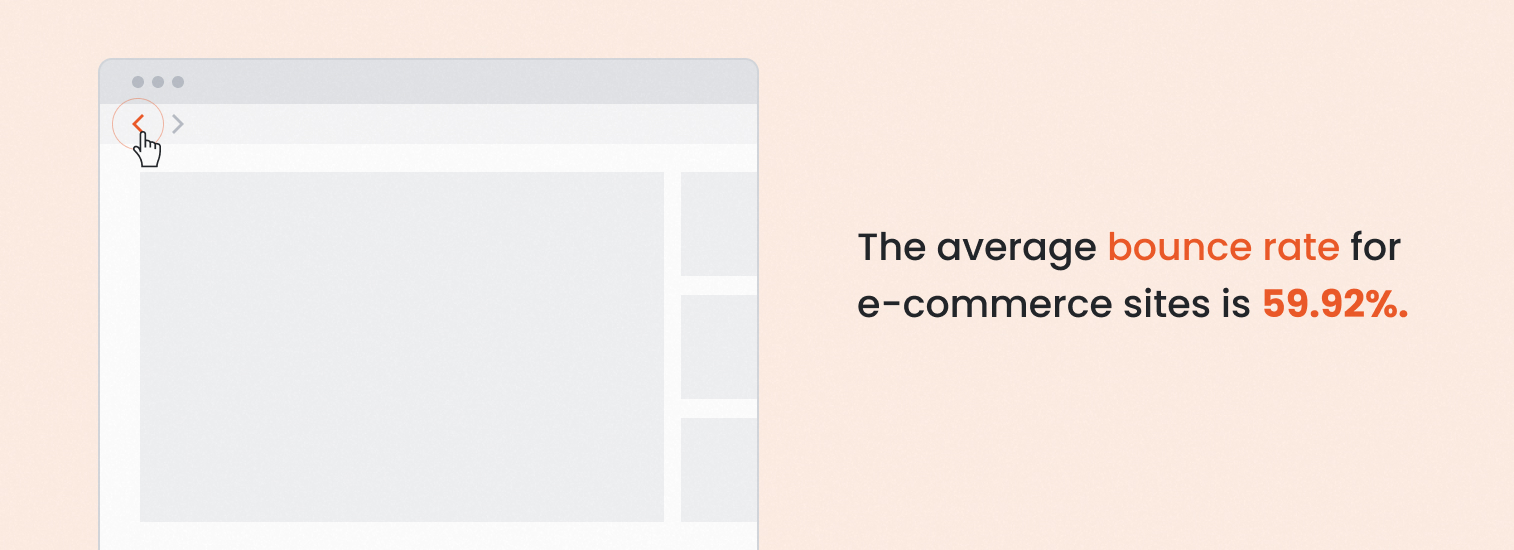
Lowering this rate can improve engagement and encourage more purchases.
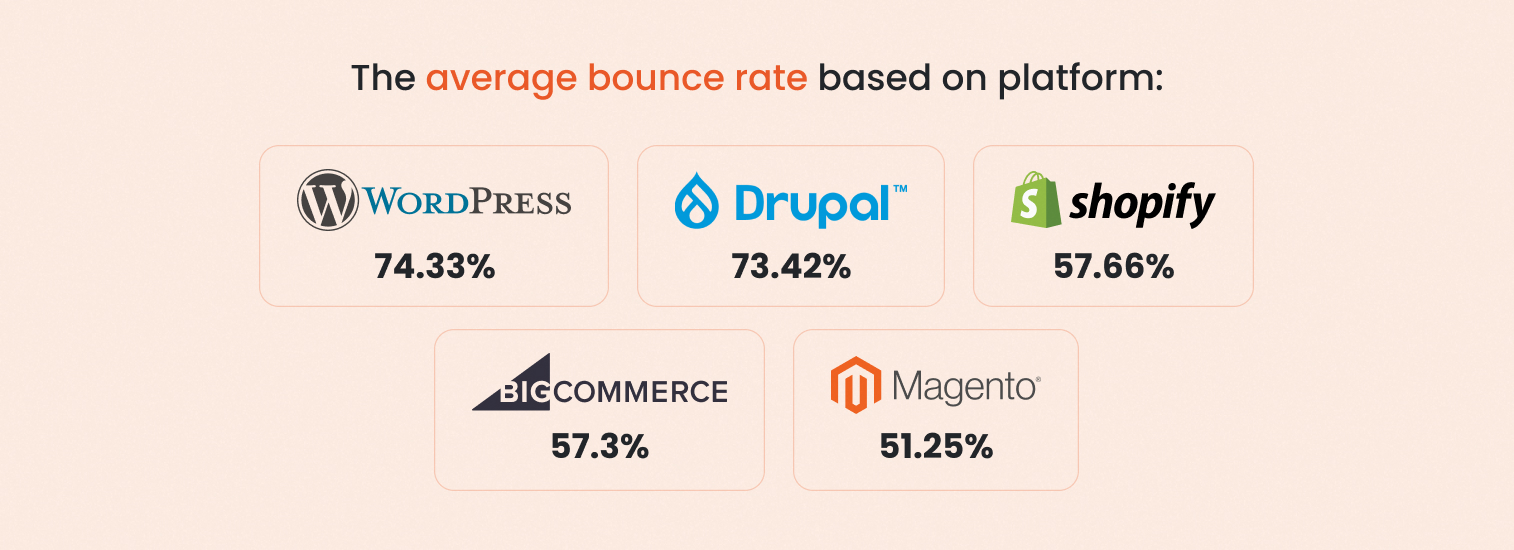
Different platforms exhibit varying bounce rates:
- WordPress: 74.33%
- Drupal: 73.42%
- Shopify: 57.66%
- BigCommerce: 57.3%
- Magento: 51.25%
As you can see, Shopify, BigCommerce, and Magento have the lowest bounce rates, indicating better visitor engagement.
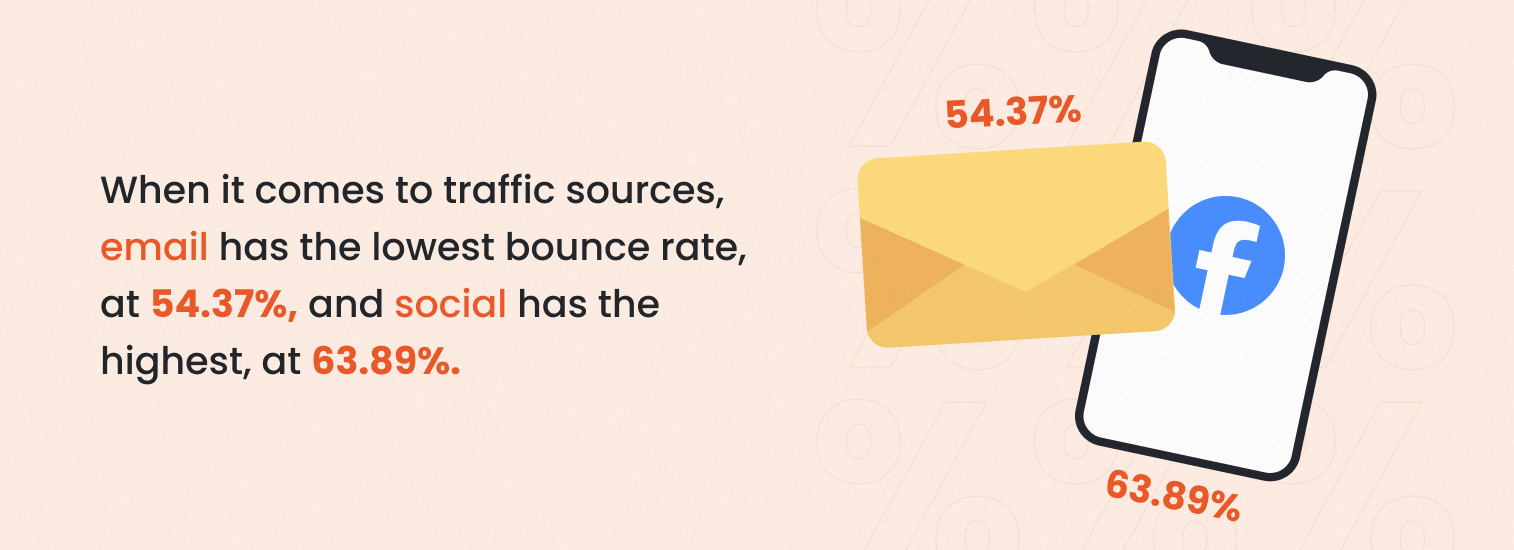
When it comes to traffic sources, email has the lowest bounce rate, at 54.37%. Social has the highest, at 63.89%.
Knowing these stats can help you tailor your content and engagement strategies to reduce bounce rates and keep visitors on your site longer. Optimizing your landing page with clear CTAs and engaging content can significantly reduce bounce rates and improve user engagement.
What's the average cart abandonment rate?
70.32% of online shoppers abandon their carts before completing a purchase.
Social media traffic has the highest cart abandonment rate, at 77.54%. This highlights the need for effective cart recovery strategies, especially for social media traffic.
Search and direct traffic have the lowest cart abandonment rates, at 63.81% and 69.39%.
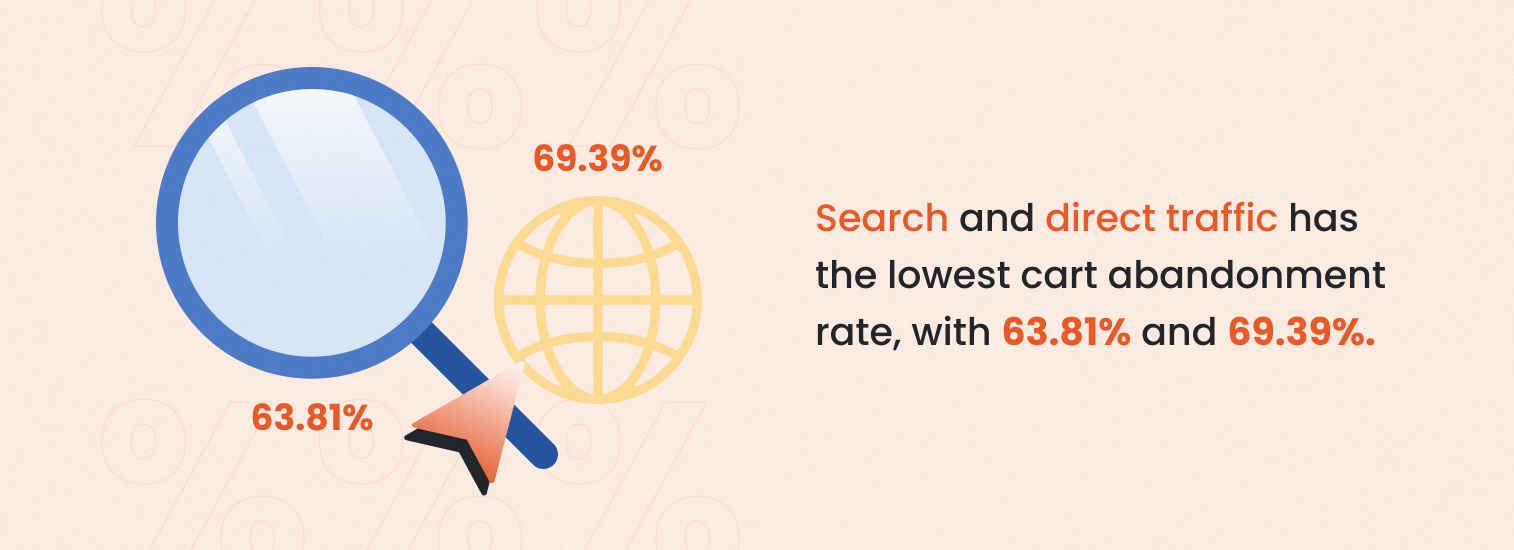
These stats are not surprising, as search and direct traffic typically bring more targeted customers compared to social media browsers. However, they highlight the importance of personalizing your messaging and treating every visitor differently.
Reducing cart abandonment rates can directly impact lead conversion, turning more visitors into paying customers.
Displaying exit-intent popups with the right offer can help to decrease cart abandonment rates. Here are a couple of exit popups you might want to try out:
What's the average pageview per session?
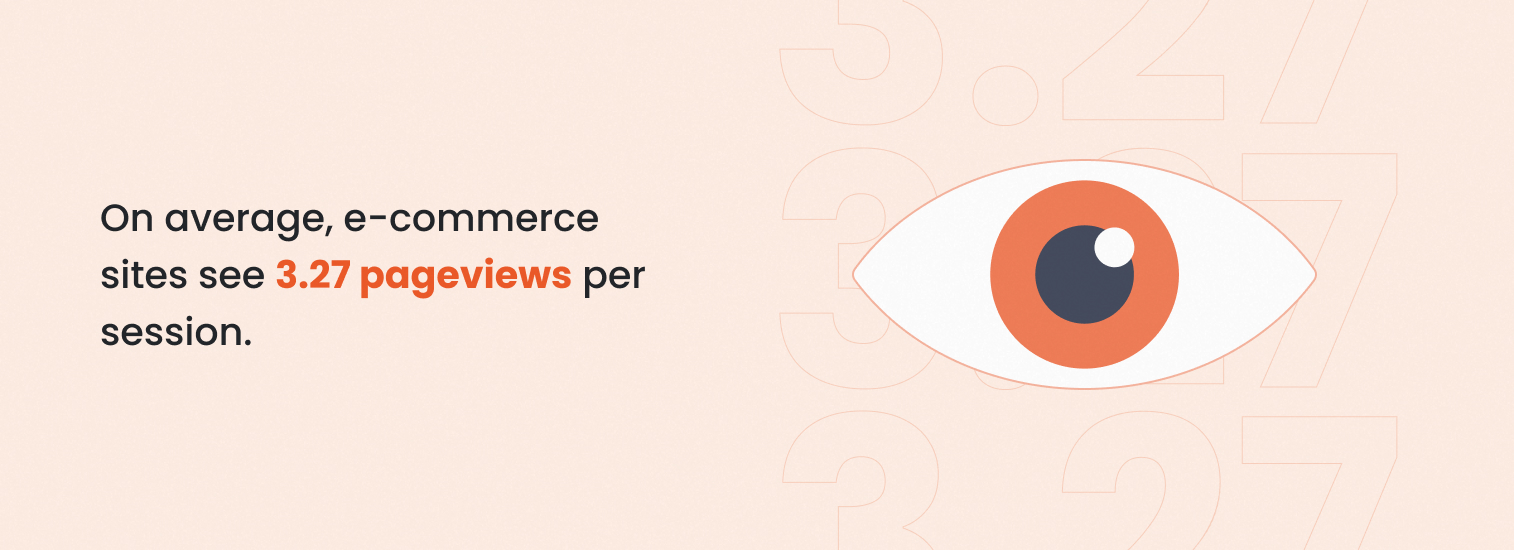
On average, e-commerce sites see 3.27 pageviews per session. This metric indicates how much content visitors explore before leaving.
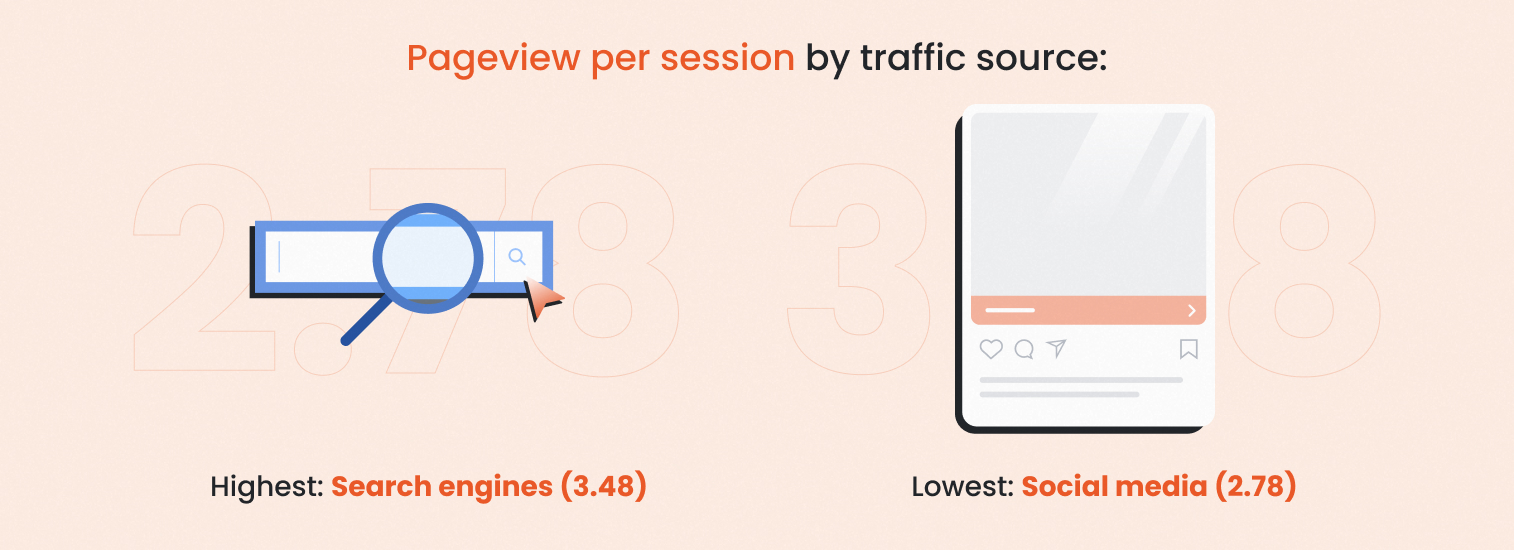
Pageview per session by traffic source:
- Lowest: Social media (2.78)
- Highest: Search engines (3.48)
Visitors from search engines tend to explore more pages, suggesting they might be more engaged or looking for specific information.
Traffic distribution by source
Understanding where your traffic comes from is crucial for optimizing your marketing efforts:
- Search engines: 30.81%
- Direct traffic: 30.41%
- Social media: 19.94%
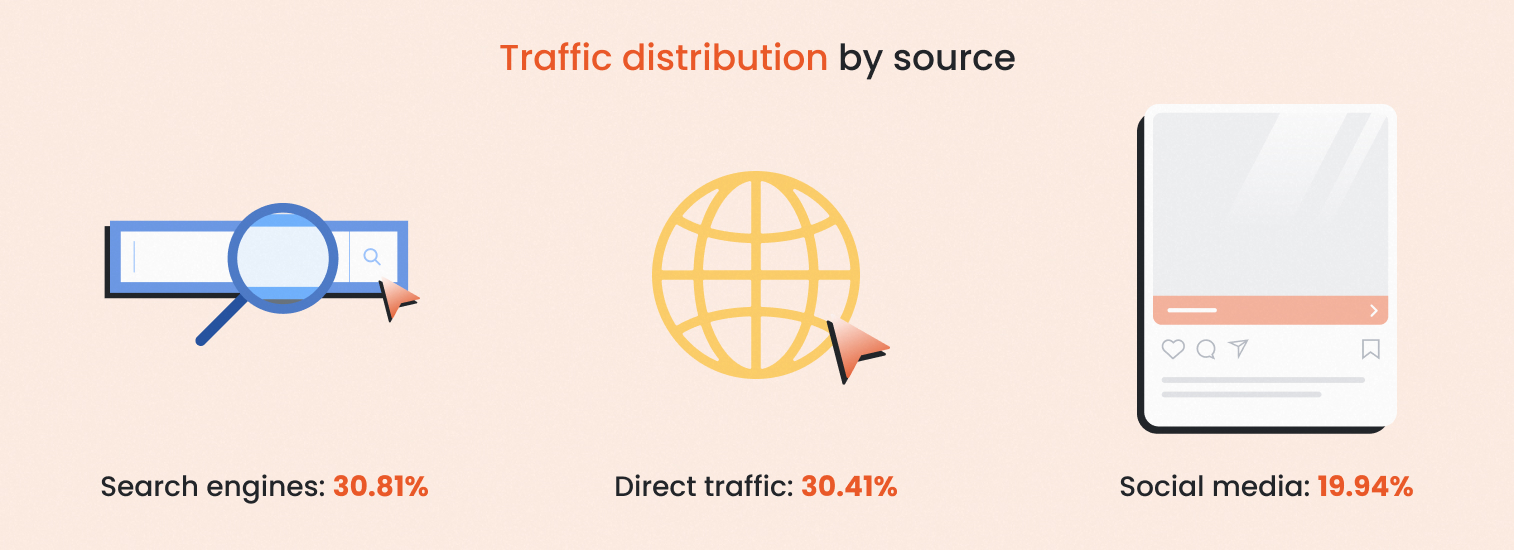
Search engines and direct traffic dominate, while social media contributes a smaller, yet significant, portion. Balancing efforts across these sources can help maintain a healthy traffic mix.
FAQ
Conversion rate optimization (CRO) is the process of increasing the percentage of visitors to your website who complete a desired action, such as making a purchase or signing up for a newsletter. This involves understanding how users navigate your site, what actions they take, and what’s preventing them from completing your goals. Through various strategies, including A/B testing, user feedback, and data analysis, a CRO strategy aims to improve the overall user experience and increase conversion rates.
Absolutely! Conversion rate optimization is worth every effort. By focusing on CRO, you can get more value from your existing traffic without spending extra on acquiring new visitors. Even small improvements in conversion rates can lead to significant increases in revenue. It’s a cost-effective way of boosting sales, enhancing the user experience, and gaining a competitive edge in the crowded ecommerce market. You can check out some CRO case studies here.
The average conversion rate across all ecommerce businesses is 1.81%. This means that out of every 100 visitors, nearly two make a purchase. While this serves as a benchmark, it’s crucial to continually strive for higher conversion rates to maximize your ecommerce success.
Wrapping up
By understanding these key ecommerce statistics, you can benchmark your site’s performance and identify areas for improvement.
Whether it’s increasing your average order value, reducing bounce rates, or optimizing for higher conversion rates, these improvements are crucial for driving ecommerce success.
Staying updated on the latest average website conversion rate statistics can help you enhance your strategies and stay competitive.
Now that you have the latest data, refine your strategies to boost your online store’s performance! OptiMonk’s conversion rate optimization tool is the perfect place to get started. Create a free account now or browse through our use cases.
Migration has never been easier
We made switching a no-brainer with our free, white-glove onboarding service so you can get started in the blink of an eye.
What should you do next?
Thanks for reading till the end. Here are 4 ways we can help you grow your business:
Boost conversions with proven use cases
Explore our Use Case Library, filled with actionable personalization examples and step-by-step guides to unlock your website's full potential. Check out Use Case Library
Create a free OptiMonk account
Create a free OptiMonk account and easily get started with popups and conversion rate optimization. Get OptiMonk free
Get advice from a CRO expert
Schedule a personalized discovery call with one of our experts to explore how OptiMonk can help you grow your business. Book a demo
Join our weekly newsletter
Real CRO insights & marketing tips. No fluff. Straight to your inbox. Subscribe now
Nikolett Lorincz
- Posted in
- Conversion
Partner with us
- © OptiMonk. All rights reserved!
- Terms of Use
- Privacy Policy
- Cookie Policy
Product updates: January Release 2025

