- Blog
- The 15 Most Important Conversion KPIs to Track in 2025 (Explained)
The 15 Most Important Conversion KPIs to Track in 2025 (Explained)
-
Nikolett Lorincz
- Conversion
- 6 min read
Table of Contents
Ecommerce moves fast. Not only are new tactics and strategies constantly popping up, but there are also new ways of keeping track of your marketing performance. Making sure that you’re always using the latest, most important conversion metrics and key performance indicators is crucial for your success.
Instead of struggling to keep up with the “hottest trends” in digital marketing, use these metrics to get a better understanding of how your audience is actually responding to your messaging.
You can be much more confident about how you’re spending your marketing budget when you have all the data points you need. Understanding your marketing investment is essential for tracking ROI and overall marketing performance.
Let’s jump right into our list of the 15 most important conversion KPIs!
1. Interactions per visit
Interactions per visit tracks the way your incoming traffic engages with your website. Usually, a higher number of interactions per visit is good news for your average conversion rate.
When users leave comments on a blog post, spend a lot of time on a certain product page, or sign up for an email newsletter, they’re showing interest in your brand.
Knowing the types of interactions visitors are having with your site is important so that you can influence their behavior in your favor.
Once you understand what your visitors like, where they spend the most time on your website, and what type of content generates shares and reviews, you can work on providing more of that!
How to track it?
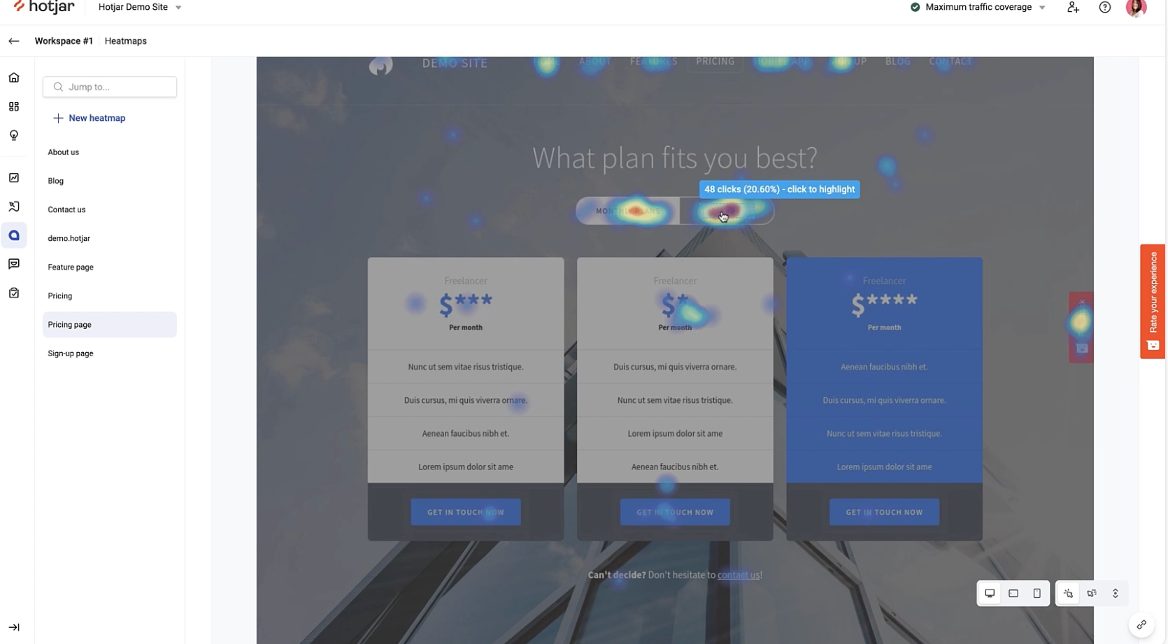
You can use tools like Hotjar or Crazy Egg to track interactions per visit.
Heatmaps can even display all the clicks that your visitors make on each page, as well as how far down they’ve scrolled. You can also watch recordings of individual visits to help you understand exactly how site visitors navigate through your website.
How to improve it?
Interactions per visit is a funny stat because increasing it doesn’t directly lead to more revenue, but rather to more interactions that will potentially lead to purchases.
You should pay particular attention to which calls to action your visitors are interacting with, since these move your visitors through the sales pipeline. Get rid of the CTAs that aren’t converting and echo the more successful ones to increase interactions (and conversions) across the board.
2. Leads generated
This metric tracks how many new people are becoming interested in your products and services. You can consider someone a lead when they show interest in your brand by taking a specific action—for ecommerce businesses, this is typically signing up for an email newsletter.
Lead generation (or lead gen) is one of the most important metrics because before people become paying customers, they’re leads! Although not every lead becomes a customer, the more leads you generate, the more potential customers you have.
How to track it?
There are many tools that can help you keep track of your lead generation. Many of them also help you split leads into different segments so that you can personalize your messaging toward them.
OptiMonk and HubSpot both help with lead generation and also help you to track your progress.
How to improve it?
The better the lead gen campaigns on your website, the more emails you’ll be able to collect.
Using a tool like OptiMonk, you can promote your email list with discount offers or other perks. This incentivizes more people to sign up and will raise the conversion rate of your lead gen campaigns.
3. New visitor conversion rate
“First impressions are everything” applies just as much in ecommerce as everywhere else. Your new visitor conversion rate measures how many new visitors become customers.
This metric lets you know whether you’re successfully grabbing the attention of first-time visitors to your website. If you’re not sending the right message, you’ll lose them and your new visitor conversion rate will suffer.
Make sure your messaging is clear, compelling and valuable to new visitors so that you make a great first impression!
How to track it?
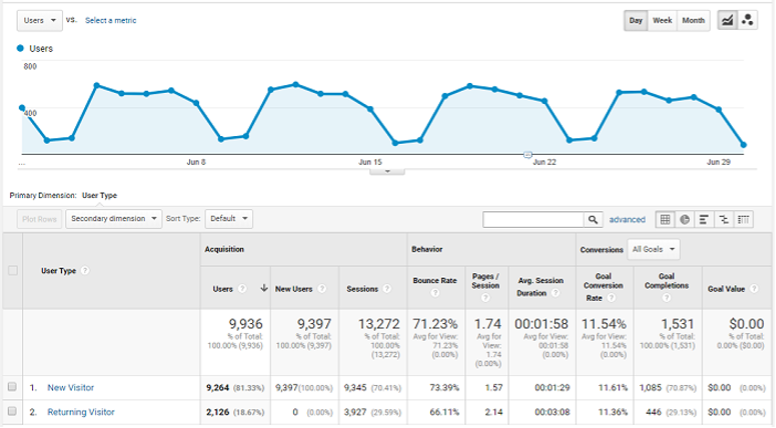
To calculate conversion rate, divide the number of conversions by the number of visitors.
But Google Analytics makes it really easy to start tracking your new visitor conversion rate.
How to improve it?
Understanding what a new visitor wants to see on the first page they encounter is crucial. You can run A/B tests to find out what messages resonate best with your first-time visitors.
Keep in mind that low usability and poor design can impact this metric.
4. Returning visitor conversion rate
Returning visitor conversion rate is a crucial measurement of customer loyalty for all sales and marketing teams. It tracks how many returning visitors (i.e. people who have already visited your site) make a purchase.
Your return visitor conversion rate helps you understand whether your messaging is resonating with users who are starting to get to know your brand. It’s also a crucial test of whether your retargeting efforts are performing well.
How to track it?
You can check your returning visitor conversion rate the same way you’d check your new visitor conversion rate in Google Analytics.
How to improve it?
Improving your returning visitor conversion rate hinges on getting people to make that final step, moving from consideration to purchase.
This is the perfect time to offer a percentage discount or a buy-one-get-one-free offer. Exit-intent popups are particularly effective for converting visitors at this stage.
5. Cost per acquisition
Cost per acquisition represents the total cost of acquiring a single customer.
It’s among the most fundamental conversion metrics because it directly measures the effectiveness of your marketing efforts. If you’re spending a lot of money on social media ads, for example, you should be benefiting from lots of purchases.
How to track it?
To calculate your cost per acquisition, all you need to do is divide your total marketing costs by the total number of unique purchasers. This tells you how much it costs to acquire a customer, regardless of traffic source.
How to improve it?
Website personalization is the best way to decrease your cost per acquisition, since it can tailor the buyer’s journey based on each person’s needs and preferences.
Personalization has the power to raise your conversion rates through the roof. Check out this article to read more about personalization.
6. Average order value
Average order value tells you the average value of each purchase.
This is one of the most important conversion metrics for understanding how your audience tends to spend money on your website.
How to track it?
To track the average value of your orders, you need to divide your total revenue by your total number of orders.
How to improve it?
There are lots of proven tactics for raising your average order value. You can use personalization to create tailored upsell and cross-sell offers.
Other effective tactics include offering free shipping for orders above a certain threshold.
7. Customer retention rate
Your customer retention rate tells you how good you are at keeping people who’ve made purchases in the past. Basically, it measures customer loyalty.
On average, retaining a customer is 7x less expensive than acquiring a new customer. Loyal customers are the lifeblood of any business, so you need to keep them happy!
How to track it?
You need three pieces of information to figure out your customer retention rate:
- Number of customers at the end of a period (E)
- Number of new customers acquired during that period (N)
- Number of customers at the start of that period (S)
When you have this info, here’s the simple calculation you can use to get the percentage:
Customer Retention Rate = ((E-N)/S)*100
How to improve it?
First of all, offering high-quality products and services is the best way to keep your customers happy. Beyond that, you can encourage your customers to create an account, run a loyalty program, or improve your email outreach.
You can also create a subscription program to encourage users to make a purchase every month.
8. Customer lifetime value
Customer lifetime value tracks the average amount of money a customer will spend from the beginning of their interaction with your brand until the end.
Lifetime value is probably one of the most important conversion metrics for measuring your success over time. As we discussed with the previous metric, retaining your customers is the best way to operate a profitable business.
Knowing your customer lifetime value helps you strike a balance between customer retention and acquisition. When you know how much the average customer will spend on your site over time, you can allocate the proper budget for customer acquisition.
How to track it?
To track lifetime value, you need to divide the lifetime customer revenue by the total lifetime customer costs.
How to improve it?
There are a number of ways to increase your customer lifetime value, including:
- increasing order frequency,
- increasing the customer lifespan,
- increasing average order value, and
- developing a subscription payment model.
9. Return on investment
Return on investment (ROI) measures the amount of profit that your digital marketing campaigns bring in.
Keeping track of your marketing ROI is important because it’s the only way you’ll know which marketing and advertising channels are the most profitable. You can double down on what’s working and stop wasting money on unprofitable marketing ploys.
How to track it?
To figure out your return on investment, you need to subtract how much you spent on marketing from your revenue. Then, you can divide your profit by the “cost of the investment” to find your ROI as a percentage.
How to improve it?
There’s no silver bullet for increasing your marketing ROI. However, following best practices for each particular marketing activity or channel is a great place to start. Another great tactic is running A/B tests on your entire website to increase the number of conversions.
10. Return on ad spend
Return on ad spend (ROAS) is similar to ROI, but it tracks how much profit a specific ad generated. Using this metric helps you know whether an ad generated more money than it cost to run.
How to track it?
To get ROAS, you just need to follow the same procedure as calculating your ROI, but only using the numbers for a single ad.
How to improve it?
The more optimized your ads are, the higher your ROAS will be. You can A/B test different versions of your ads to find out what works best. It’s also important to ensure that you’re targeting the right audience with each ad.
Check out this article for 3 quick personalization tactics to boost your Facebook ad ROI.
11. Bounce rate
Your bounce rate is the percentage of site visitors that exit your site almost immediately after arriving.
Every customer that bounces from your page is a missed opportunity. After all, you work really hard to generate traffic for your site, so you want to maximize the average time each visitor spends there.
How to track it?
Calculating your bounce rate requires dividing the number of people who exit your site without making a single click by the total number of visitors.
How to improve it?
You want to start by improving your landing pages and ensuring they have a clear message that’s immediately apparent.
You can also optimize your product pages, making the user experience as smooth as possible, and ensuring your calls to action are clear and compelling.
You can read about some other techniques in this article.
12. Exit pages/exit rates
Your exit page stats record which page each user was on when they left your site after viewing more than one page. Exit rates are a great way to identify where you can make improvements to your site and what you need to optimize.
How to track it?
Google Analytics is the best tool to help you figure out your exit rate. You’ll be able to see what percentage of people are leaving each individual page.
How to improve it?
Once again, personalization is a great way to address problems on specific pages. You can also use exit-intent popups to offer users a reason to keep browsing. For example, showing relevant product recommendations on exit popups is a great way to convince visitors to stick around.
13. Lead quality
Lead quality measures the potential of leads to convert into paying customers.
High-quality leads are those that closely match your target customer profile and show a strong interest in your product or service.
Assessing lead quality ensures that your sales team focuses on leads most likely to result in successful conversions, maximizing efficiency and revenue.
How to track it?
To track lead quality, use tools that analyze lead data such as demographics, behavior, and engagement levels. CRM systems like HubSpot can score leads based on these criteria, helping prioritize follow-ups with the most promising leads.
How to improve it?
Improve lead quality by refining your targeting strategies and qualifying leads effectively.
Use detailed buyer personas to guide your marketing efforts and attract the right audience. Implement lead scoring models to evaluate and prioritize leads, ensuring your sales team focuses on high-potential prospects.
14. Lead-to-opportunity ratio
The lead-to-opportunity ratio measures how effectively leads move through your sales funnel and become potential sales opportunities. This metric is essential for identifying how well your marketing tactics translate into qualified prospects.
How to track it?
Track the lead-to-opportunity ratio using CRM systems like Salesforce or HubSpot. These tools help monitor the progress of leads through the sales pipeline and calculate the ratio by comparing the number of leads generated to the number of opportunities created.
How to improve it?
To improve this ratio, focus on lead nurturing and qualification. Develop targeted content and automated email campaigns to engage leads and guide them through the funnel. Ensure your sales team prioritizes high-quality leads.
15. Landing page conversion rates
Landing page conversion rates measure the percentage of visitors who complete a desired action on a specific landing page, such as signing up for a newsletter or making a purchase. This metric helps evaluate the effectiveness of your landing pages in driving conversions.
How to track it?
Use tools like Google Analytics to monitor the performance of your landing pages. These tools provide insights into visitor behavior and conversion rates, helping you identify high-performing pages and those needing improvement.
How to improve it?
To boost landing page conversion rates, optimize page design and content. Ensure your call-to-action (CTA) is clear and compelling, and the page is visually appealing and user-friendly.
A/B testing different elements like headlines, images, and CTAs can also help determine what resonates best with your audience. Utilizing tools like OptiMonk can facilitate these tests and drive more website conversions.
FAQ
What is conversion rate optimization?
Conversion rate optimization (CRO) is the process of improving your website and marketing efforts to increase the percentage of visitors who complete a desired action, such as making a purchase or filling out a form. It involves analyzing user behavior, testing different elements, and implementing changes to enhance the overall user experience and drive higher conversion rates.
What are the most important key performance indicators for ecommerce stores?
Some KPIs for ecommerce stores include conversion rate, average order value, customer acquisition cost, and cart abandonment rate.
How to get more paying customers?
Ensure your site is user-friendly, mobile-optimized, and fast. Clear navigation and an easy checkout process enhance the customer experience. Use reviews and testimonials to build trust with potential customers. Provide discounts, free shipping, or limited-time offers to drive conversions. You can also use paid ads to re-engage website visitors who left without purchasing.
Final thoughts
So there you have it: the top 15 conversion KPIs you need to be watching!
These conversion metrics are crucial for helping you improve your website and grow your business. Unless you know what’s working and what’s not, you’re going to have trouble making those crucial improvements.
It’s important to remember that none of these conversion metrics can tell you the full story. By combining insights from several conversion metrics, you’ll have a much better idea of what’s really going on.
Now it’s time to start tracking your conversion KPIs and optimizing your marketing efforts!
Migration has never been easier
We made switching a no-brainer with our free, white-glove onboarding service so you can get started in the blink of an eye.
What should you do next?
Thanks for reading till the end. Here are 4 ways we can help you grow your business:
Boost conversions with proven use cases
Explore our Use Case Library, filled with actionable personalization examples and step-by-step guides to unlock your website's full potential. Check out Use Case Library
Create a free OptiMonk account
Create a free OptiMonk account and easily get started with popups and conversion rate optimization. Get OptiMonk free
Get advice from a CRO expert
Schedule a personalized discovery call with one of our experts to explore how OptiMonk can help you grow your business. Book a demo
Join our weekly newsletter
Real CRO insights & marketing tips. No fluff. Straight to your inbox. Subscribe now
Share this article
Written by

Nikolett Lorincz
Nikolett is the Head of Content at OptiMonk. She is obsessed with content marketing and loves creating educational content for ecommerce store owners. She truly believes in the importance of quality over quantity.
You may also like
- Posted in
- Conversion
Partner with us
- © OptiMonk. All rights reserved!
- Terms of Use
- Privacy Policy
- Cookie Policy
Product updates: January Release 2025