- Blog
- What Are the Most Important Popup Statistics in 2025?
What Are the Most Important Popup Statistics in 2025?
-
Nikolett Lorincz
- Conversion
- 6 min read
Table of Contents
To help you get the most out of them in 2025, we’ve analyzed the performance of countless popups created by OptiMonk users. By digging into the data, we’ve uncovered key trends and surprising insights into what works—and what doesn’t.
In this article, you’ll discover 18 crucial website popup statistics that will help you create high-converting popups, build a robust email list, and boost your sales.
Whether you’re just getting started or looking to refine your pop-up strategy, this data-driven guide is your key to effective popups in 2025.
Let’s dive in!
Check out our infographic below to see all 18 popup statistics in one place, and read the article for detailed explanations.
Which website popup statistics matter most in 2025?
Here are some key statistics that reveal how popups perform across different scenarios, from average conversion rates to the differences between desktop and mobile users.
Popup statistic #1: The average popup conversion rates
First, let’s start with the ever-burning question: what’s the average pop-up conversion rate?
According to our results, the average conversion rate for pop-ups is 11.09%.
But you shouldn’t be disappointed if one of your website popups was below this conversion rate.
When and how a popup is used makes a big difference to conversion rates. For example, a newsletter popup typically converts way less than a cart abandonment popup. That’s because customers are in very different stages of your conversion funnel. We’ll talk about this more later.
Now, let’s see more popup statistics!
Popup statistic #2: The highest-performing popups
When we took a look at the top 10% of our website popups, we found that their average conversion rate was 42.35%.
That means almost half of the people who saw one of these top-performing popups ended up converting!
Later, we’ll share some tips on how to improve your popup conversion rate. But first, let’s see how mobile and desktop popups perform.
Popup statistic #3: Desktop conversion rate
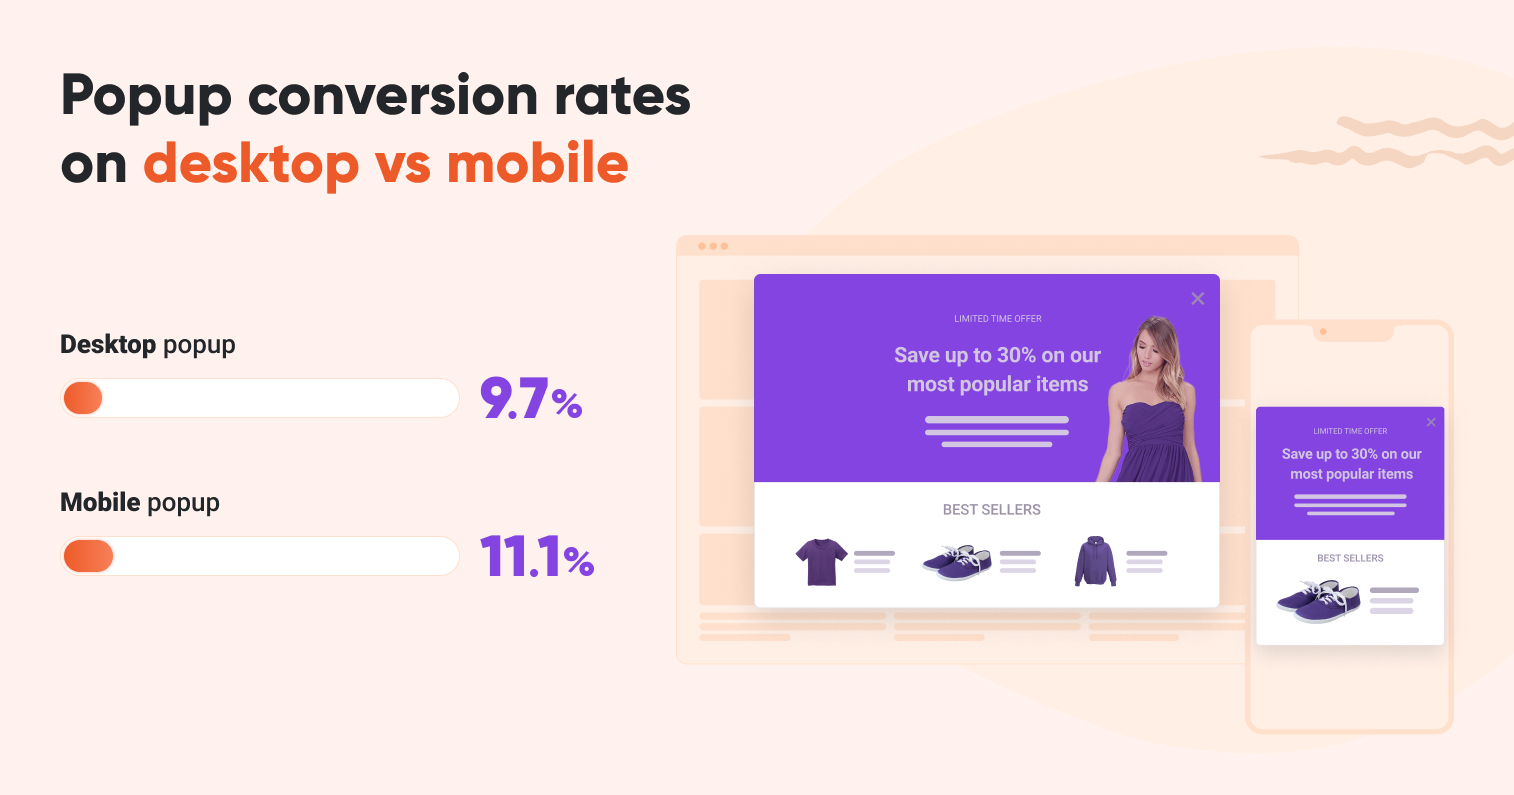
Since so many people visit websites via mobile devices (a whopping 61% of site visits), we wanted to see how well OptiMonk popups convert on mobile devices vs. desktops.
We were happy with the results. The average desktop conversion rate was 9.69%, while…
Popup statistic #4: Mobile conversion rate
…mobile popups converted at 11.07%.
We weren’t surprised, though. All of our popups are mobile-friendly, and the OptiMonk Editor has great options for designing mobile popups.
Which popup use cases perform best?
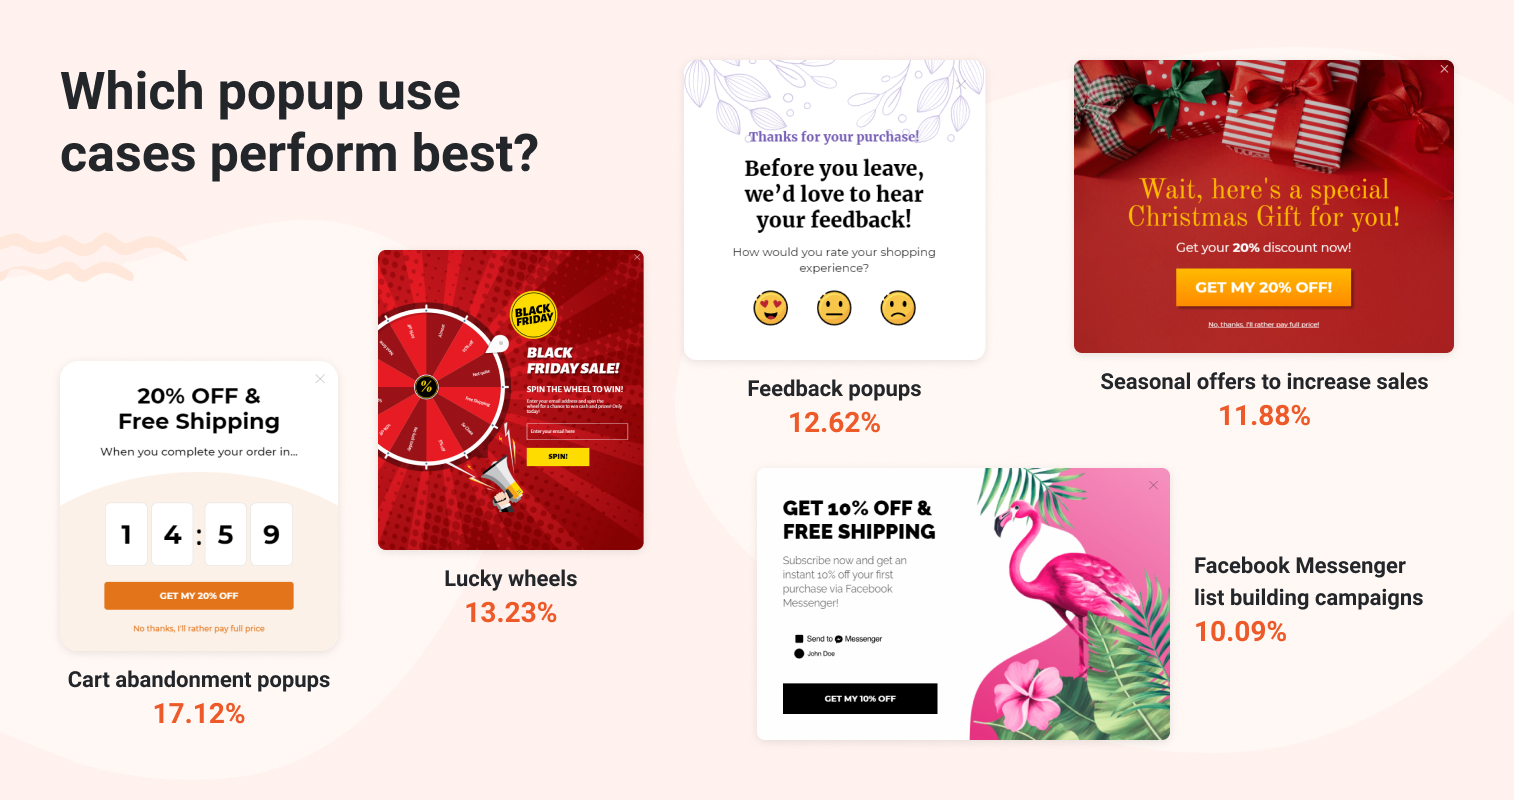
We’ve collected the five best-performing popup use cases below.
Popup statistic #5: Cart abandonment popups have a 17.12% conversion rate
Unsurprisingly, our cart abandonment popups (i.e., exit-intent popups shown to people who have added items to their cart) had the highest average conversion rate: 17.12%.
They perform so well because they target abandoning visitors who are probably ready to make a purchase, but something stops them from paying (e.g. high shipping costs).
A cart abandonment popup can deliver a simple reminder.
But we see the highest conversion rates for those that offer an incentive like free shipping or 10% off. And they work best when the incentive being offered is for a limited time.
Popup statistic #6: Lucky wheels have a 13.23% conversion rate
Lucky wheels (or spin-to-win popups) are a gamified popup that lets your visitors “play” in exchange for their email addresses. They get to spin a wheel that contains different levels of discounts and offers.
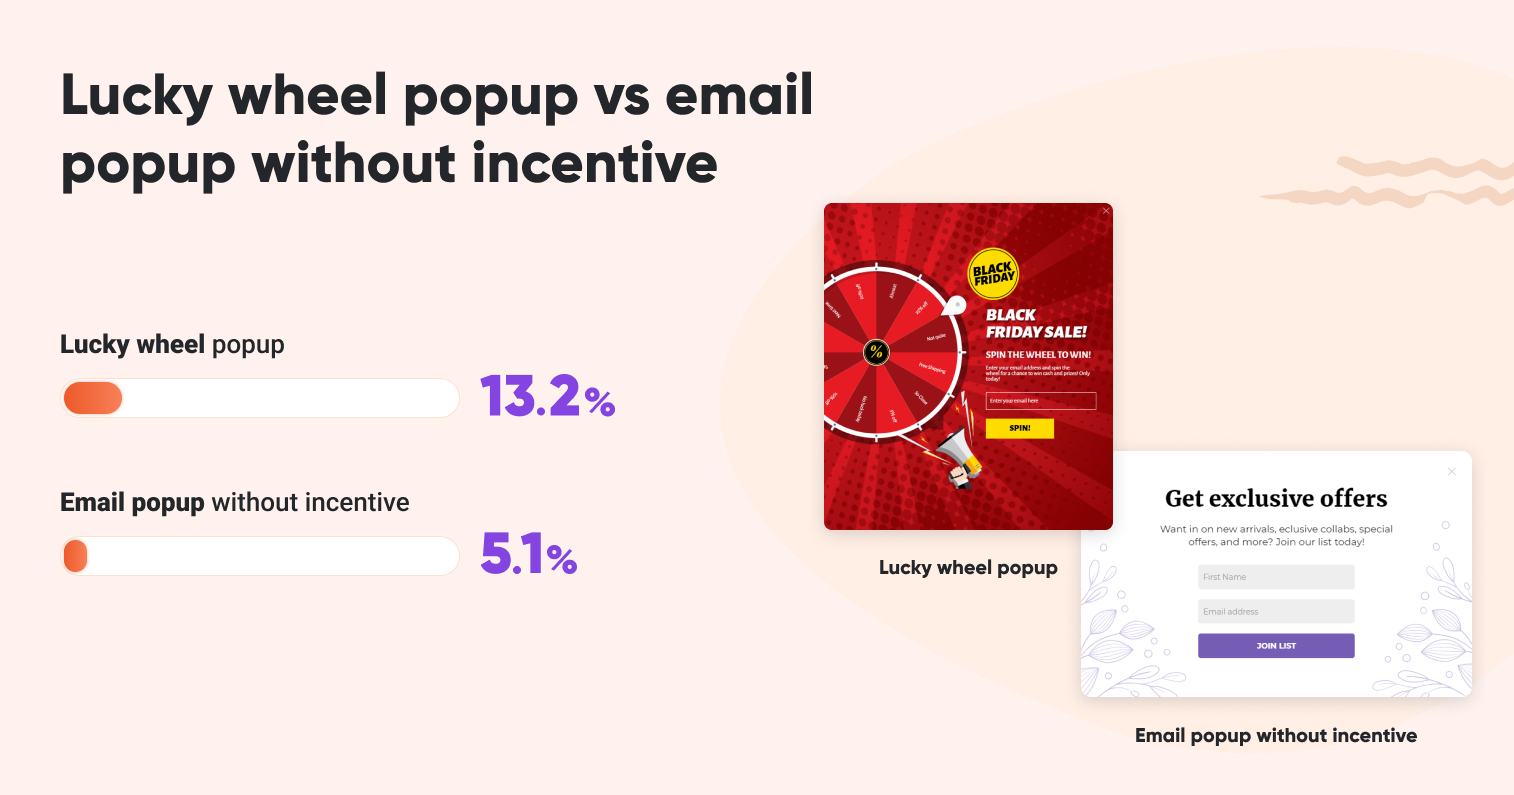
Gamified popups lead to huge engagement numbers. In fact, they have a 13.23% average conversion rate.
Popup statistic #7: Feedback popups have a 12.62% conversion rate
A feedback popup prompts your website visitors to share their thoughts and feelings about your website, products, or prior purchase experiences. You can even use one to ask them why they decided not to buy.
These popups improve your site and user experience since customers appreciate that you want to hear their feedback.
They’re usually happy to answer a few simple questions. So it’s no surprise that the average conversion rate is 12.62%
Popup statistic #8: Seasonal offer popups have a 11.88% conversion rate
Seasonal popups have an 11.88% average conversion rate. These are special offers tied to a specific day or event.
Some seasonal offers are about a specific holiday, like Christmas, Valentine’s Day, or Memorial Day. Others relate to a time of year like Spring, Summer, or back-to-school season.
These popups work well because there’s already a sense of urgency baked into them. Customers need to buy presents before Christmas and pencils before the first day of school. And they know that your deal is also for a limited time only.
Popup statistic #9: Facebook Messenger list-building campaigns have a 10.09% conversion rate
These list-building popups are designed to do exactly what their name suggests: they get people to subscribe to your messenger lists.
Since visitors are usually already signed into their Facebook, a conversion only takes one simple click. They don’t need to type in their email address or anything else.
These popups provide a great user experience and have a 10.09% average conversion rate.
What about email popups?
Perhaps you’re surprised that you didn’t see email-gathering popups above. It’s because they aren’t among the best-performing campaigns.
There are a few reasons why conversions are harder to come by when you’re building an email list.
First off, we can see that more people sign up via Facebook Messenger because it’s user-friendly and easy to access: one click.
The more complex the sign-up process becomes, the lower your conversion rates will drop. Hence: the less effort your prospect has to make, the higher your conversion rates will be.
There’s also the fact that the target audience for email campaigns is new visitors. Since they’re at the beginning of their buyer’s journey, they won’t necessarily want to sign up for a newsletter just yet.
But there are some differences in how well email popups convert based on the incentives. Let’s take a look.
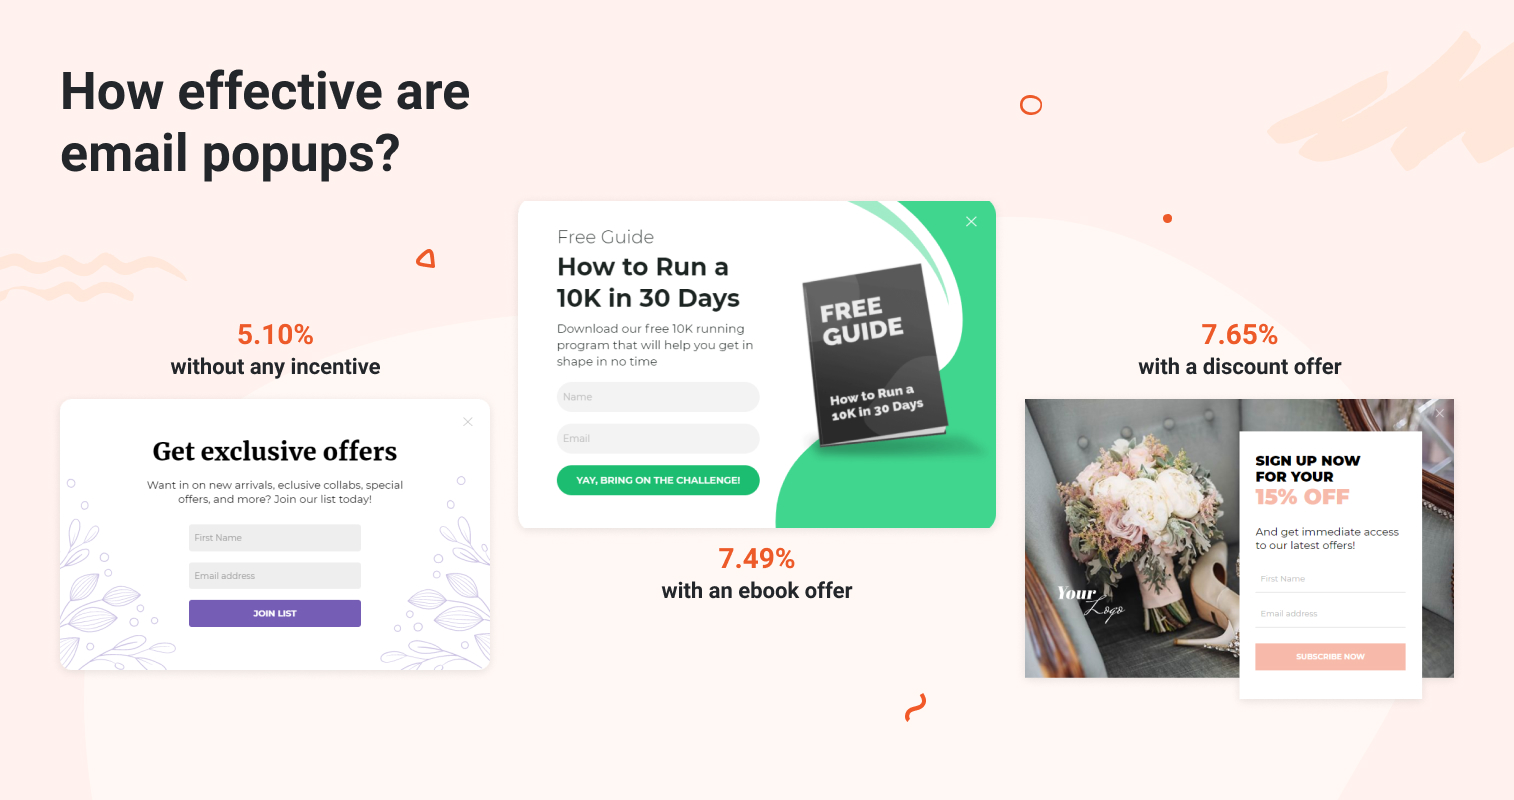
Popup statistic #10: Simple newsletter promotion popups have a 5.10% conversion rate
It’s difficult to get tons of email signups just by simply asking for them. And that’s what we found in the data.
Our incentive-free email popups had a 5.10% average conversion rate.
It’s not impossible to grow your email list without offering any incentives. You just have to convince your website visitors that they’ll benefit from your emails. That means being explicit about what they can expect to see and how it will improve their lives.
For example, Brand Growth Experts achieved an 8.33% conversion rate with a simple newsletter promotion popup.
Popup statistic #11: Offering an ebook in exchange for subscription increases conversion rate to 7.49%
Offering an ebook in exchange for subscribing to your newsletter is a much higher converting approach to gathering emails—a 7.49% success rate.
This tactic doesn’t offer a monetary incentive to your customers, but it does promise them something of value.
To get good results using this method, it’s crucial that the ebook is useful and grabs the interest of your visitors.
One idea to accomplish this is to tailor your ebooks to your visitors’ actions. For example, if they’re browsing a specific category, you can offer a guide about “how to find the perfect bicycle.”
Popup statistic #12: Offering a discount in exchange for a newsletter subscription increases conversion to 7.65%
Here we’ve got a slight improvement too: a 7.65% average conversion rate!
Consumers tend to expect a discount in exchange for signing up for a newsletter. So it’s a good idea to tie these offers to a customer’s first purchase.
This will capture that target audience of new visitors that aren’t yet familiar with your site. Trust us—they’ll start looking even harder for something to buy when they know they have a discount in hand.
What will make your popups work better?
Now that we’ve gone over the numbers for each use case, let’s take a look at some data-driven tips that can drive more conversions for your popups.
You can apply most of these tips to a range of different types of popups.
Let’s dive right in!
Popup statistic #13: Gamification popups convert better than simple email popups
As we’ve seen, our lucky wheel popups (13.23%) perform better than other types of email popups (5.10% – 7.65%).
Therefore, it’s a good idea to gamify your email popups.
This does mean that you’ll have to offer discounts (as otherwise there’s nothing to win). But OptiMonk allows you to adjust the odds, so you can make sure that your campaign is profitable.
Popup statistic #14: Conversational popups are a great way to build relationships and email lists at the same time
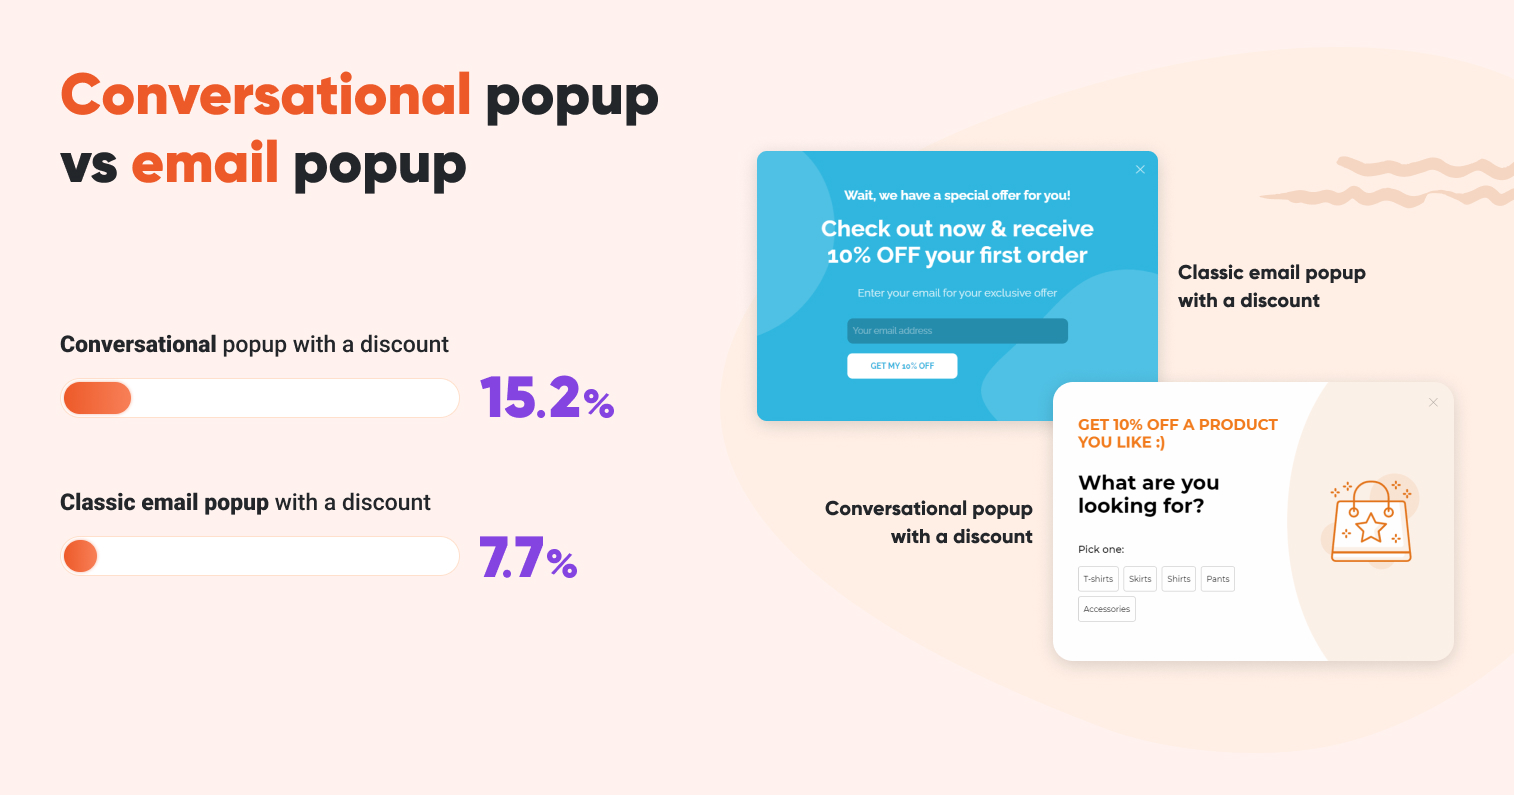
OptiMonk’s conversational popups engage customers in communication that gets them interested in signing up for your email newsletter.
First, you ask a question that helps segment your visitors. On the second page, you’ll ask for their email address. Then, you’ll display personalized product recommendations based on their answers.
Our data indicates that their average conversion rate is 15.2%. And as a bonus—they help collect information about your customer’s interests and preferences.
Popup statistic #15: Refreshing your popups regularly is a good thing for conversions
Seasonal popups convert at over 11%.
A rule of thumb is that you’ve got to keep popups fresh and relevant to get good conversion rates, and seasonal popups help you achieve that.
Popup statistic #16: Countdown timers increase conversions
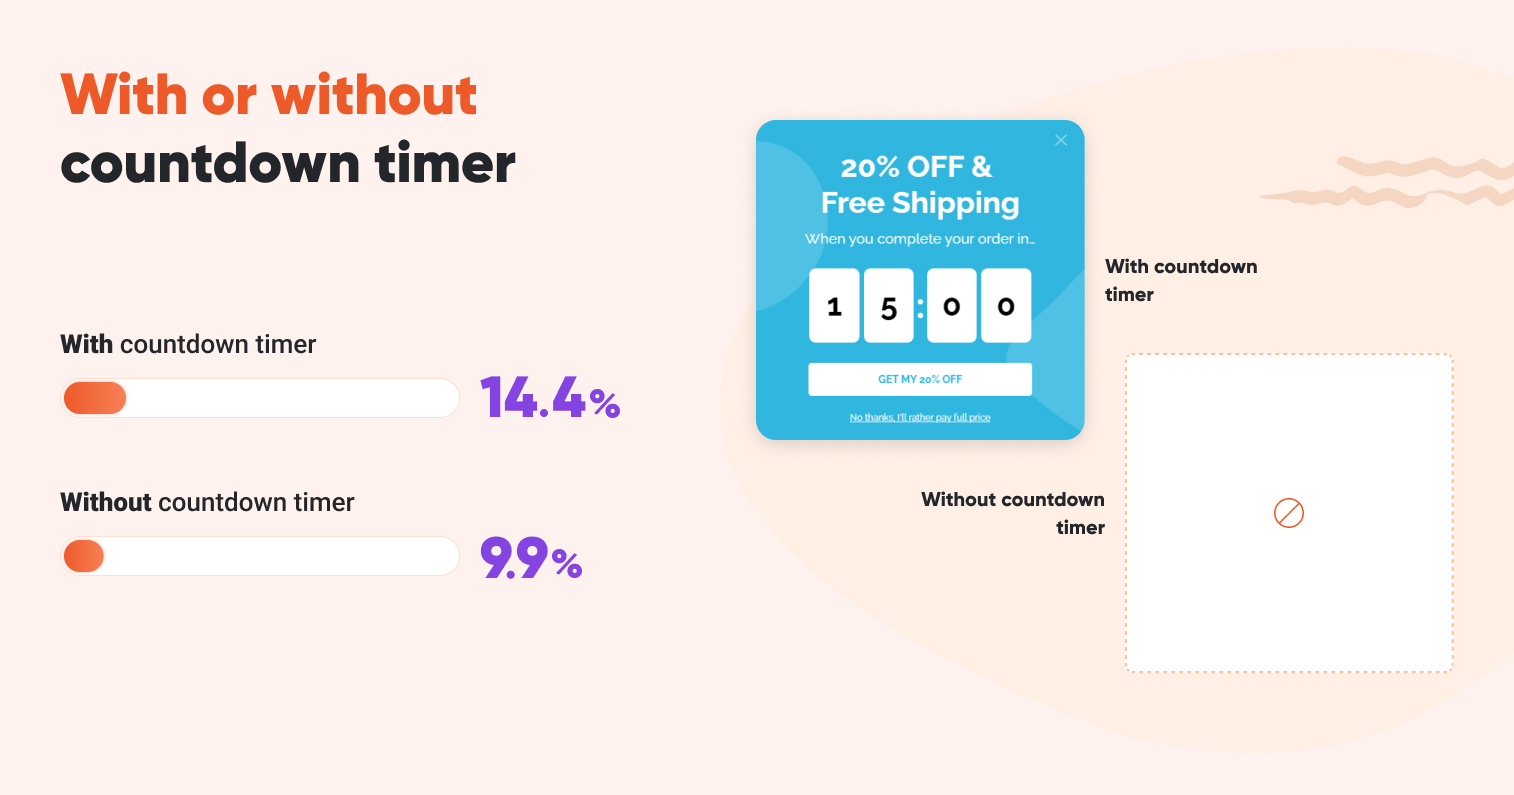
A ticking clock is a great way to ramp up a sense of urgency. The average conversion rate for popups with a countdown timer is 14.41%, in contrast to 9.86% for those without.
It doesn’t mean that you should add fake urgency to your popups. Instead, it’s worth offering time-limited deals for your customers.
Popup statistic #17: Images vs. no images
Conventional wisdom would suggest that popups with pictures should perform better, but our data doesn’t support that.
Popups with images have an 11.09% conversion rate, while those without images convert 11.08% of the time. So it doesn’t really matter if you use images or not. Offering real value is much more important.
Popup statistic #18: Use fullscreen popups to increase conversions to 14.40%
Popups that take up the entire browser window can lead to a conversion of 14.40%.
They do so well because popups are about directing your visitors’ attention to your message. And fullscreen popups do this very effectively.
Keep in mind that you need to use the right segmentation. Otherwise, you can annoy visitors by showing them fullscreen popups that aren’t relevant to them.
FAQ
Why are email popups less effective than others?
Email popups without incentives convert at just 5.10%. Adding a discount or lead magnet (like an ebook) can raise this to 7.5%–7.65%, but they still underperform gamified or exit-intent popups.
Do countdown timers increase conversions?
Yes. Popups with countdown timers average a 14.41% conversion rate, compared to 9.86% without them—thanks to the urgency they create.
Which popup types convert best?
Fullscreen popups average a 14.40% conversion rate—higher than most formats—because they effectively capture visitor attention.
Key takeaways
We hope you’ve enjoyed this rundown of key popup stats.
The biggest takeaway is popups are an effective tool for driving conversions. As we saw, the average conversion rate of popups was 11.09%.
And if you follow our best popup practices, you’ll achieve way higher conversion rates.
We’ve also observed that:
- Cart abandonment popups and lucky wheels convert at a very high rate.
- Seasonal deals are still the way to go. Max out your potential in the 4th quarter when shoppers are primed to buy.
- There are challenges involved in collecting email subscribers. To combat that, don’t forget to offer an incentive to visitors.
Take a look through our Template Library and start putting together high-converting popups! It’s free and you can get started in minutes.
Migration has never been easier
We made switching a no-brainer with our free, white-glove onboarding service so you can get started in the blink of an eye.
What should you do next?
Thanks for reading till the end. Here are 4 ways we can help you grow your business:
Boost conversions with proven use cases
Explore our Use Case Library, filled with actionable personalization examples and step-by-step guides to unlock your website's full potential. Check out Use Case Library
Create a free OptiMonk account
Create a free OptiMonk account and easily get started with popups and conversion rate optimization. Get OptiMonk free
Get advice from a CRO expert
Schedule a personalized discovery call with one of our experts to explore how OptiMonk can help you grow your business. Book a demo
Join our weekly newsletter
Real CRO insights & marketing tips. No fluff. Straight to your inbox. Subscribe now
Nikolett Lorincz
- Posted in
- Conversion
Partner with us
- © OptiMonk. All rights reserved!
- Terms of Use
- Privacy Policy
- Cookie Policy
Product updates: January Release 2025

